아시아의 대도시 목록
List of metropolitan areas in Asia아시아는 세계에서 가장 빠르게 성장하는 대륙 중 하나로, 도시화가 증가하고 도시의 성장률이 높습니다.일본의 도쿄는 인구가 세계에서 가장 큰 대도시 지역입니다.
주어진 도시의 인구는 다음의 5가지 출처에서 얻습니다.
- 도시들
- 월드 아틀라스
- 국가 공식 견적(NOE)
이 다섯 가지 출처 중에서 가장 높은 추정치는 굵은 글씨로 표시됩니다.도시들은 가장 높은 인구 추정치를 기준으로 순위가 매겨집니다.몇 가지 의견:
- 중국 도시의 공식 통계는 보통 도시 지역을 훨씬 넘어 상당한 농촌 인구를 구성하는 지방 자치체에 대한 것입니다.충칭, 우한 및 선양의 경우와 같이 이러한 통계가 추정 수치를 초과할 경우에는 고려되지 않습니다.
- 도시 인구에서 상하이의 수치는 쑤저우(상하이에서 북서쪽으로 약 100km 또는 62마일)를 포함하며, 이는 다른 추정치나 공식 통계에 포함되지 않으므로 고려되지 않습니다.
- 도시 인구에서 광저우의 수치는 선전, 둥관, 중산, 장먼 및 후이저우를 포함하는 광둥성의 도시 인구에 대한 것입니다.이 지역은 아직 단일 수도권으로 개발되지 않았기 때문에 이 수치는 고려되지 않았습니다.선전과 둥관은 이 표에 별도로 나열되어 있습니다.
- 인구통계학과 월드 아틀라스는 인접 도시인 취안저우, 진장, 스시에 대한 수치를 제공합니다.도시 인구는 샤먼(인구 4-480만)의 수치에 이 세 도시를 포함하여 총 인구는 10,000,000명입니다.그러나 샤먼은 실제로 다른 세 도시와 인접하지 않으며 이 통계는 고려되지 않습니다.
- 도시 인구에서 델리의 수치는 파리다바드, 가지아바드, 구르가온을 포함하며, 이는 다른 추정치나 공식 통계에 포함되지 않으므로 고려되지 않습니다.
- 도시 인구에서 뭄바이의 수치는 다른 추정치나 공식 통계에 포함되지 않아 고려되지 않은 비완디, 칼얀, 테인, 울하스나가르, 바사이비라르 도시를 포함합니다.
이 표는 각 도시가 아시아의 어느 지역에 있는지를 보여주기 위해 색으로 구분되어 있습니다.색상 코드 키는 다음과 같습니다.
20개의 도시가 있는 동아시아는 이 목록에 포함된 도시의 절반을 차지하며, 중국이 15개의 도시로 가장 많고, 남아시아가 10개의 도시로 두 번째이며, 그 중 7개가 인도에 있습니다.동남아시아는 7개의 도시를 차지하고 서아시아는 4개의 도시만 있습니다.
목록.
| 순위 | 지역 | 이미지 | 나라 | 메트로 인구. (가장 낮은 값)[1] | 인구통계학 (2017년 동.)[2] | UN WC (2016est.)[3] | 세계 아틀라스 (2017년 동.)[4] | 공식 또는 다른. | 동년 |
|---|---|---|---|---|---|---|---|---|---|
| 1 | 광저우-포산 | 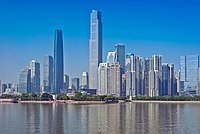 | 67,800,000[5] | 19,075,000 | 광저우 13,070,000[6] 포산 7,089,000[6] | 20,597,000 | 12,700,800[7] | – | |
| 2 | 뭄바이 |  | 26,600,000 | 23,355,000 | 21,357,000[6] | 17,712,000 | 47,800,000[8] | 2001 | |
| 3 | 델리 |  | 33,400,000 | 29,617,000 | 26,454,000[6] | 24,998,000 | 41,034,555 [9][10] | 2011 | |
| 4 | 도쿄 |  | 40,800,000 | 37,977,000 | 38,140,000[11] | 37,843,000 | 31,714,000[12] | 2005 | |
| 5 | 상하이 | 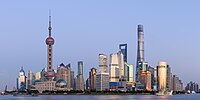 | 40,000,000 | 23,390,000 | 24,484,000[9] | 23,416,000 | 23,019,148[13] | 2010 | |
| 6 | 자카르타 |  | 28,900,000 | 14,540,000 | 10,483,000[9] | 30,539,000 | 15,519,545 [14] | 2010 (센서스 최종) | |
| 7 | 마닐라 |  | 26,700,000 | 24,245,000 | 13,131,000[6] | 24,123,000 | 11,553,427[15] | 2007 | |
| 8 | 서울 | 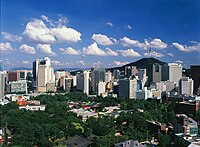 | 24,900,000 | 21,794,000 | 서울 9,979,000[9] 인천 2,711,000[9] | 23,480,000 | 26,015,868 [16] | 2007 | |
| 9 | 다카 | 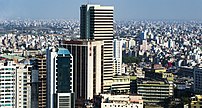 | 21,300,000 | 16,820,000 | 18,237,000[11] | 15,669,000 | 12,797,394[17] | 2008 | |
| 10 | 베이징 |  | 20,900,000 | 20,415,000 | 21,240,000[6] | 21,009,000 | 19,612,368[18] | 2010 | |
| 11 | 방콕 | 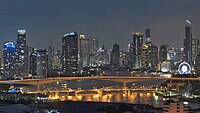 | 20,500,000 | 15,645,000 | 9,440,000[11] | 14,998,000 | 8,249,117 [19] | 2010 | |
| 12 | 오사카-고베-교토(게이한신) | 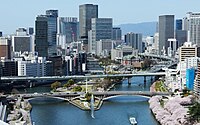 | 17,700,000 | 17,075,000 | 20,337,000[11] | 17,440,000 | 16,663,000[12] | 2005 | |
| 13 | 콜카타 |  | 17,400,000 | 14,950,000 | 14,980,000[6] | 14,667,000 | – | – | |
| 14 | 청두 |  | 16,600,000 | 11,050,000 | 7,820,000[6] | 10,376,000 | – | – | |
| 15 | 테헤란 |  | 16,200,000 | 13,805,000 | 8,516,000[9] | 13,532,000 | 13,422,366[20] | 2006 | |
| 16 | 이스탄불[21] |  | 16,100,000 | 15,154,000 | 14,365,000[9] | 14,163,989 | 15,519,267[22] | 2019 | |
| 17 | 첸나이 |  | 15,900,000 | 12,395,000 | 10,163,000[6] | 9,714,000 | 8,696,010 | 2022[23] | |
| 18 | 충칭 |  | 10,500,000 | 7,990,000 | 13,744,000[6] | 7,217,000 | 28,846,170[24][25] | 2010 | |
| 19 | 방갈로르 | 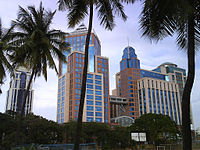 | 13,700,000 | 10,535,000 | 10,456,000[6] | 8,728,906 | 8,499,399 | 2011[23] | |
| 20 | 호찌민 시 |  | 13,500,000 | 10,380,000 | 7,498,000[6] | 8,957,000 | 7,955,000 | 2016 | |
| 21 | 항저우 |  | 13,400,000 | 6,820,000 | – | 7,275,000 | – | – | |
| 22 | 톈진 | 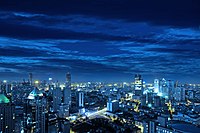 | 11,400,000 | 13,245,000 | 11,558,000[6] | 10,920,000 | 12,938,224[26] | – | |
| 23 | 선전 | 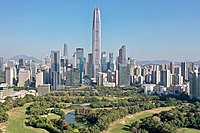 | 광저우에 포함된 | 12,775,000 | 10,828,000 | 12,084,000[6] | 10,357,938[27] | – | |
| 24 | 우한 | 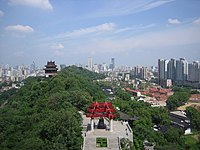 | 11,800,000 | 7,895,000 | 7,979,000[6] | 7,509,000 | 9,785,392[28][29] | – | |
| 25 | 하이데라바드 |  | 11,100,000 | 9,305,000 | 9,218,000[6] | 8,754,000 | – | – | |
| 26 | 나고야 |  | 10,500,000 | 10,070,000 | 9,434,000[11] | 10,177,000 | 9,046,000[12] | 2005 | |
| 27 | 정저우싱양 | 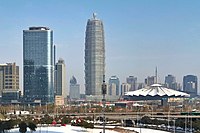 | 9,450,000 | 7,005,000 | 4,539,000[6] | 4,942,000 | – | – | |
| 28 | 아메다바드 |  | 9,300,000 | 7,645,000 | 7,571,000[6] | 7,186,000 | – | – | |
| 29 | 타이페이 | 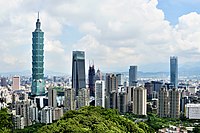 | 9,200,000 | 8,550,000 | 2,669,000[6] | 7,438,000 | 8,916,653 [20] | 2010 | |
| 30 | 리야드 |  | 9,150,000 | 6,030,000 | 6,540,000[9] | 5,666,000 | 6,506,000 | 2014 | |
| 31 | 쿠알라룸푸르 |  | 9,100,000 | 7,590,000 | 7,047,000[6] | 7,088,000 | 1,768.00 [30][31] | 2015 | |
| 32 | 난징 | 9,050,000 | 6,320,000 | – | 6,155,000 | – | – | ||
| 33 | 선양 |  | 8,550,000 | 7,935,000 | 6,438,000[6] | 6,078,000 | 8,106,171[32] | – | |
| 34 | 둥관 |  | 광저우에 포함됨 | 8,310,000 | 7,469,000[6] | 8,442,000 | – | – | |
| 35 | 하노이 |  | 7,000,000 | 7,785,000 | 3,790,000[6] | 3,715,000 | – | – | |
| 36 | 싱가포르 |  | 7,750,000 | 5,825,000 | 5,717,000[6] | 5,624,000 | 5,607,300 [33] | 2017 | |
| 37 | 바그다드이다. |  | 7,500,000 | 6,960,000 | 6,811,000[6] | 6,625,000 | – | – | |
| 38 | 홍콩 |  | 7,300,000 | 7,330,000 | – | 7,246,000[6] | 7,246,000 | – | |
| 39 | 취안저우-스시-진장 |  | 샤먼에 포함됨 | 6,480,000 | 1,469,000[6] | 6,710,000 | – | – |
참고 항목
레퍼런스
- ^ Brinkhoff, Thomas (2023-01-01). "The Principal Agglomerations of the World". CityPopulation. Retrieved 2023-03-07.
- ^ "Demographia World Urban Areas 13 Th Annual Edition: 2017:04" (PDF). Retrieved 2017-08-02.
- ^ "World cities in 2016: Data Booklet" (PDF). The United Nations: Population Division. Retrieved 2017-08-02.
- ^ "World's Largest Cities". Archived from the original on 28 August 2017. Retrieved 2017-08-02.
- ^ 이 수치는 아직 단일 대도시 지역으로 개발되지 않은 선전, 둥관, 중산, 장먼, 후이저우를 포함하는 광둥성의 도시 인구에 대한 것입니다.
- ^ a b c d e f g h i j k l m n o p q r s t u v w x y z aa 도시 집합체
- ^ 广州市2010年第六次全国人口普查主要数据公报 (in Chinese). Statistics Bureau of Guangzhou. 2011-05-16. Archived from the original on 2011-07-20. Retrieved 2011-05-25.
- ^ "Basic Statistics for Mumbai". MMRDA: Mumbai Metropolitan Region Development Authority. Retrieved 2009-11-07.
- ^ a b c d e f g h 도시 고유의
- ^ 델리 인구 조사
- ^ a b c d e 메트로폴리탄 지역
- ^ a b c "Table 2.10 Population of Three Major Metropolitan Areas" (PDF). Ministry of Internal Affairs and Communications (Japan). Archived from the original (PDF) on 2009-11-13. Retrieved 2009-11-07.
- ^ "Shanghai sixth national census in 2010 Communiqué on Major Data, Chinese: 上海市2010年第六次全国人口普查主要数据公报". Shanghai Municipal Statistics Bureau. 3 May 2011. Archived from the original on 26 November 2011. Retrieved 16 August 2011.
- ^ "Statistics Indonesia". Archived from the original on 2010-10-13. Retrieved 2010-10-13. BPS: Hari Statistic National Sensus Penduduk 2010(공식 2010 인구 조사 수치), 정의에서 요약.
- ^ "Metro Manila at a glance". Metropolitan Manila Development Authority. Retrieved 2009-08-25.[데드링크]
- ^ "Seoul National Capital Area Statistics" (in Korean). Korean National Statistical Office. Retrieved 2009-11-06.
- ^ "Statistical Pocket Book, 2008" (PDF). Bangladesh Bureau of Statistics. Archived from the original (PDF) on 2009-04-19. Retrieved 2009-08-28.
- ^ "Communiqué of the National Bureau of Statistics of People's Republic of China on Major Figures of the 2010 Population Census". National Bureau of Statistics of China. Archived from the original on 2013-07-27.
- ^ "National Statistical Office of Thailand" (PDF). Archived from the original (PDF) on 2016-05-01. Retrieved 2017-08-03.
- ^ a b "Monthly Bulletin of Interior Statistics 2011.4". Department of Statistics, Ministry of the Interior, Taiwan/R.O.C. Archived from the original on 2014-03-29.
- ^ 이스탄불은 유라시아에 걸쳐 있는 대륙 횡단 도시입니다.인구의 대부분은 유럽 쪽의 상업적이고 역사적인 중심지에 살고 있고 인구의 약 3분의 1은 보스포루스 해협의 아시아 쪽 교외에 살고 있지만 인구 수치는 도시 전체를 포함합니다.
- ^ "The Results of Address Based Population Registration System (2019)". Turkish Statistical Institute. 31 December 2019. Retrieved August 9, 2020.
- ^ a b http://www.censusindia.gov.in/2011-prov-results/paper2/data_files/India2/Table_3_PR_UA_Citiees_1Lakh_and_Above.pdf[베어 URL PDF]
- ^ 2010년 인구조사
- ^ 도시 지역을 훨씬 넘어서는 지방 자치체의 수치(31,816 sqmi)
- ^ "Communiqué of the National Bureau of Statistics of People's Republic of China on Major Figures of the 2010 Population Census[1] (No. 2)". National Bureau of Statistics of China. 29 April 2011. Archived from the original on 27 July 2013. Retrieved 18 November 2011.
- ^ 深圳市2010年第六次全国人口普查主要数据公报[1] (in Chinese). Shenzhen Municipal Statistic Bureau. 2014-05-12. Archived from the original on 2011-08-04. Retrieved 2011-07-28.
- ^ "武汉市2010年第六次全国人口普查主要数据公报". Wuhan Statistics Bureau. 10 May 2011. Archived from the original on 25 October 2011. Retrieved 31 July 2011.
- ^ 도시 지역을 훨씬 넘어서는 지방 자치체의 수치(3,279.71 평방미터)
- ^ 쿠알라룸푸르 연방 준주
- ^ 2015년 인구 전망
- ^ "武汉市2010年第六次全国人口普查主要数据公报". Shenyang Statistics Bureau. 20 May 2011. Archived from the original on 15 August 2013. Retrieved 18 November 2011.
- ^ 싱가포르 통계 [1] Wayback Machine에서 2014/08/02 검색된 2015-11-29 아카이브
- ^ 도시 인구는 샤먼(인구 4-480만)의 수치에 이 세 도시를 포함하여 총 인구는 10,000,000명입니다.그러나 샤먼은 실제로 인접하지 않습니다.


