HSL 및 HSV
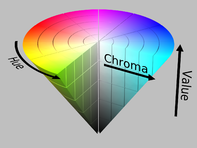
HSL and HSVHSL(색조, 포화, 밝기) 및 HSV(색조, 포화, 값, 색조, 채도, 밝기)는 RGB 컬러 모델의 대체 표현으로, 1970년대에 컴퓨터 그래픽 연구자에 의해 인간의 시각에 의한 색채 형성 속성에 보다 밀접하게 일치하도록 설계되었습니다.이러한 모델에서는, 각 색상의 색상은, 하단의 검정색으로부터 상단의 흰색까지를 가지는 중성색의 중심축을 중심으로, 방사상의 슬라이스 형태로 배치된다.
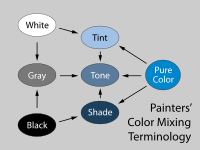
HSL 표현은 실제 환경에서 다양한 페인트가 혼합되어 색상을 생성하는 방식을 모델링합니다. 밝기 치수는 혼합된 검은색 또는 흰색 페인트의 다양한 양과 유사합니다(예: "밝은 빨간색"을 만들기 위해 빨간색 안료를 흰색 페인트와 혼합할 수 있습니다). 이 흰색 페인트는 HSL Repre의 높은 "밝기" 값에 해당합니다.송신)원 둘레에 완전 포화색을 θ의 명도값으로 배치하고, 각각 완전 흑색 또는 완전 백색에 대응하는 명도값 0 또는 완전 포화색을 배치한다.
한편, HSV 표현은 빛이 비칠 때 색상이 어떻게 보이는지를 모델링합니다.HSL과 HSV의 차이점은 HSL의 최대 밝기를 가진 색상은 순수한 흰색이지만 HSV의 최대값/밝기를 가진 색상은 유색 물체에 흰 빛을 비추는 것과 유사하다는 것이다(예를 들어 붉은 물체에 밝은 흰 빛을 비추면 물체는 여전히 붉고 밝으며 더 강렬하게 보이는 동시에 희미하게 빛난다).t를 지정하면 개체가 어둡고 밝지 않게 나타납니다).
HSV와 HSL의 문제는 이러한 접근법이 [1][2][3]색에 대한 인간의 인식에 따라 색상을 세 가지 가치 구성요소로 효과적으로 분리하지 못한다는 것입니다.이는 채도 설정을 변경하면 알 수 있습니다. "V" 또는 "L" 설정은 고정되어 있어도 지각 밝기의 차이를 쉽게 알 수 있습니다.
기본원칙
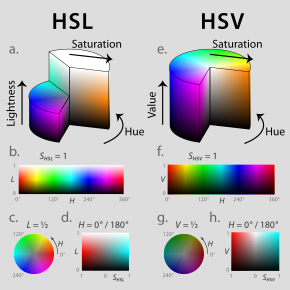
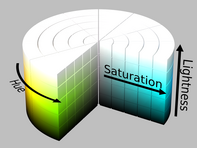
HSL과 HSV는 둘 다 원통형 기하학(그림 2)으로 색상, 각도 치수는 0°에서 빨간색 1차에서 시작하여 120°에서 녹색 1차, 240°에서 파란색 1차 통과 후 360°에서 빨간색으로 감싼다.각 지오메트리에서 중심 수직축은 명도 1의 흰색(값 1)에서 명도 0의 검은색(값 0) 범위의 중립색, 무채색 또는 회색으로 구성된다.
두 기하학에서 빨간색, 노란색, 녹색, 시안, 파란색 및 자홍색이라는 추가 원색 및 보조 색상과 인접한 쌍의 선형 혼합물은 채도 1로 실린더의 바깥쪽 가장자리를 중심으로 배열됩니다.이러한 포화 색상의 밝기는 HSL에서는 0.5이지만 HSV에서는 1입니다.이러한 순수한 색상과 블랙을 혼합하면, 이른바 음영을 만들어 내는 것으로, 채도는 변하지 않습니다.HSL에서는 흰색으로 색칠해도 채도는 변하지 않으며, 흑백의 혼합(톤이라고 불린다)만이 채도가 1 미만입니다.HSV에서는 색칠만으로도 채도가 낮아집니다.

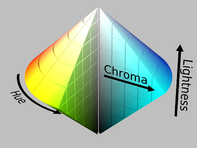
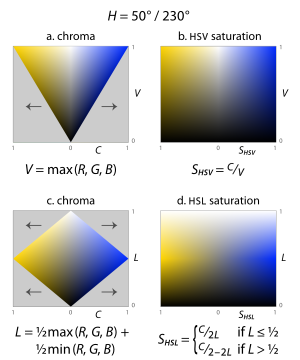
매우 어두운 색(두 모델 모두) 또는 매우 밝은 색(HSL)을 완전히 포화 상태로 간주하기 때문에(예를 들어 슬라이스된 HSL 실린더의 오른쪽 하단 또는 오른쪽 상단) 색 순도에 대한 직관적인 개념과 상충되기 때문에(그림 3), 종종 원뿔 또는 바이코닉 고체가 대신 그려집니다.채도(포화도가 (bi)콘의 슬라이스에서 최대 채도에 대한 채도와 동일한) 대신 채도(RGB 값의 범위와 동일)를 방사상 치수라고 합니다.혼란스럽지만, 이러한 다이어그램은 보통 이 반경 치수에 "포화도"라고 라벨을 붙여 채도와 [A]채도의 차이를 흐리게 하거나 지웁니다.아래와 같이 채도를 계산하는 것은 각 모델의 도출에 도움이 되는 단계입니다.이러한 중간 모델은 치수 색상, 채도, HSV 값 또는 HSL 밝기가 원뿔 또는 바이콘의 형태를 취하기 때문에 HSV는 종종 "헥스콘 모델"이라고 불리는 반면 HSL은 종종 "bi-hexcone 모델"이라고 불립니다(그림 8).[B]
동기
HSL 색 공간은 1938년 Georges Valensi에 의해 기존의 흑백(L 신호만 포함) 방송에 색 인코딩을 추가하여 휘도(흑백) 신호가 변경되지 않고 기존 수신기가 새로운 색 방송을 수신할 수 있도록 하는 방법으로 텔레비전용으로 발명되었습니다.NTSC, PAL 및 SECAM을 포함한 모든 주요 아날로그 방송 TV 인코딩 및 모든 주요 디지털 방송 시스템에서 사용되며 합성 [4][5]비디오의 기반이 됩니다.
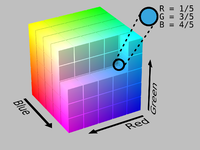
대부분의 텔레비전, 컴퓨터 디스플레이 및 프로젝터는 빨강, 초록, 파랑의 빛을 다양한 강도로 조합하여 색상을 생성합니다.이것을 RGB 가산 원색이라고 합니다.RGB 색공간에서의 혼합은 다양한 색채(가마트라고 불린다)를 재현할 수 있습니다.단, 빨강, 초록, 파랑의 구성량과 그 결과 발생하는 색채의 관계는 특히 경험이 없는 사용자, 페인트나 종래의 아티스트의 감산적인 색채 혼합에 익숙한 사용자에게는 의미가 없습니다.색조 및 음영을 기반으로 한 모델(그림 4).게다가, 가색 모델이나 감색 모델 모두 인간의 눈과 같은 방식으로 [C]색 관계를 정의하지 않습니다.
예를 들어, 0 ~255 범위의 3개의 슬라이더에 의해 색상이 제어되는 RGB 디스플레이가 있다고 가정해 보겠습니다.이 슬라이더는 빨강, 초록, 파랑의 각 프라이머리 강도를 제어합니다.sRGB 값이 R = 217, G = 118, B = 33인 비교적 컬러풀한 오렌지에서 시작하여 컬러풀함을 절반으로 줄이고 싶다면 아래 그림과 같이 슬라이더를 드래그하여 R을 31감소하고 G를 24감소하고 B를 59감소시켜야 합니다.
보다 전통적이고 직관적인 색채 혼합 모델을 수용하기 위해 PARC와 NYIT의 컴퓨터 그래픽 선구자들은 1970년대 중반에 컴퓨터 디스플레이 기술을 위한 HSV 모델을 선보였습니다.이 모델은 Alvy Ray[13] Smith가 1978년 8월호에서 공식적으로 설명했습니다.같은 호에서 Joblove와 Greenberg는[14] HSL 모델을 설명하고 HSV와 비교했습니다(그림 1).이들의 모델은 색상, 밝기, 채도와 같은 다른 색채 특성 측면에서 색상이 어떻게 구성되고 개념화되었는지에 더 기초했으며, 밝은 색 안료를 검은색 또는 흰색과 혼합하여 더 밝거나 어둡거나 덜 화려하게 만드는 전통적인 색채 혼합 방법(예: 그림)에 더 기초했습니다.색채.
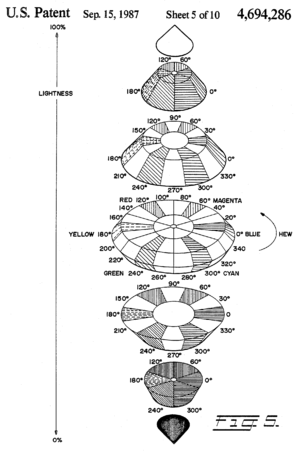
이듬해인 1979년 SIGGRAPH에서 Tektronix는 HSL을 사용하여 색상 지정을 하는 그래픽 단말기를 선보였고, 컴퓨터 그래픽 표준 위원회는 연례 현황 보고서에서 이를 권장했습니다(그림 7).이러한 모델은 원시 RGB 값보다 직관적일 뿐만 아니라 RGB 변환과 RGB 변환이 매우 빨라서 1970년대 하드웨어에서 실시간으로 실행할 수 있었기 때문에 유용했습니다.그 결과, 이러한 모델이나 유사 모델은, 그 이후, 화상 편집이나 그래픽스 소프트웨어 전체에 널리 보급되고 있습니다.그 용도의 일부를 [15][16][17][18]이하에 나타냅니다.
형식 파생
발색 속성
HSL 및 HSV 지오메트리의 치수는 CIE 또는 ASTM과 같은 과학자들에 의해 정의된 것과 같이 동일한 이름의 광도계 색채 생성 속성과 직접 관련이 없습니다.그럼에도 불구하고,[D] 모델의 파생에 뛰어들기 전에 이러한 정의를 검토할 가치가 있다.다음에 나오는 컬러 메이킹 속성의 정의에 대해서는,[19][20][21][22][23][24] 다음을 참조해 주세요.
- 휴
- "영역이 인식되는 색상 중 하나(빨강, 노랑, 초록, 파랑) 또는 [19]두 가지 색상의 조합에 따라 나타나는 시각적 감각의 특성"
- 광도(Le,Ω)
- 단위 투영 면적당 단위 고체 각도당 특정 표면을 통과하는 빛의 복사력. 평방미터당 스테라디안당 와트(W·sr−1·m−2) 단위로 측정된다.
- 휘도(Y 또는v,Ω L)
- 일반적인 인간 관찰자에 대한 각 파장의 영향에 의해 가중된 광도로, SI 단위로 평방미터당 칸델라(cd/m2) 단위로 측정된다.종종 휘도라는 용어는 상대 휘도 Y/Y에n 사용되는데, 여기서n Y는 기준 백색점의 휘도이다.
- 루마(Y))
- JPEG 압축 및 비디오 전송에 Y'CbCr에서 사용되는 감마 보정 R', G' 및 B'CbCr에서 사용됩니다.
- 휘도(또는 값)
- "영역이 빛을 [19]더 적게 방출하는 것처럼 보이는 시각적 감각의 특성"
- 가벼움
- "비슷하게 조명된 [19]흰색의 밝기와 관련된 밝기"
- 컬러풀함
- "영역의 지각된 색상이 다소 색채적으로 보이는 시각적 감각의 특성"[19]
- 크로마
- "비슷하게 조명된 [19]흰색의 밝기와 관련된 색채"
- 포화도
- "자신의 [19]밝기와 관련된 자극의 색채"
밝기와 색채는 절대적인 척도로, 보통 눈에 들어오는 빛의 스펙트럼 분포를 설명하는 반면, 밝기와 색채는 어떤 흰색 점을 기준으로 측정되며, 따라서 종종 표면 색상의 설명에 사용되며, 밝기와 색채가 다른 조명과 함께 변화하더라도 대략 일정하게 유지됩니다.채도. 채도는 채도와 밝기의 비율 또는 채도와 밝기의 비율로 정의될 수 있다.
일반적인 접근법
HSL, HSV 및 관련 모델은 기하학적 전략을 통해 도출되거나 "일반화된 LHS 모델"의 특정 인스턴스로 간주될 수 있습니다.그래서 검은 발신지에서로 수직 축을 따라 위로 흰에게 달려 있는 HSV색 공간 model-builders 색 R, G, B∈[0,1][E]—and 코너에 선회를 설명에서, 큐브에서 그 축 주위에 그들의 각도로 시작하여 색의 빛깔을 빨강, 녹색 및 파랑 빛을 RGBcube—with 구성하는 양이 걸렸다. wi0°에서 빨간색이 됩니다.그런 다음 밝기/값/밝기의 특성을 제시하고 다른 파라미터 쌍에 [6][13][14]대해 축을 따라 0에서 가장 화려한 점 1까지 채도를 정의했습니다.
색상 및 채도
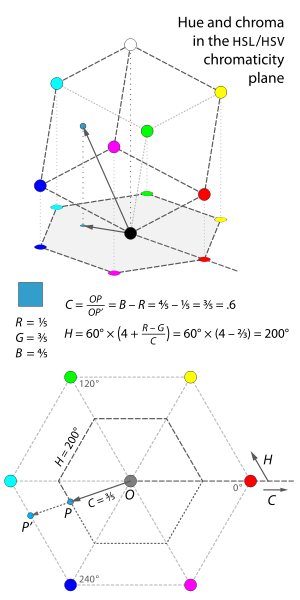
각각의 모델에서 Joblove와 Greenberg(1978)의 이름을 따서 이 기사에서 채도라고 부르는 색상과 채도를 모두 같은 방식으로 계산합니다. 즉, 색상의 색상은 이 모든 모델에서 채도와 같은 수치입니다.기울어진 RGB 입방체를 중성축에 수직인 "색도 평면"에 투영하면 모서리에 빨간색, 노란색, 녹색, 시안, 파란색 및 마젠타가 있는 육각형 모양이 됩니다(그림 9).색조는 투영된 점에 대한 벡터의 대략적인 각도이며, 빨간색은 0°이고, 채도는 [F][G]원점에서 점의 대략적인 거리입니다.
보다 정확하게는 이 모델의 색상 및 채도 모두 투영의 육각형 모양과 관련하여 정의됩니다.채도는 원점에서 육각형 가장자리까지의 거리의 비율입니다.인접한 도표의 하부에서 이것은 길이 OP/OPθ의 비율 또는 두 육각형의 반지름의 비율이다.이 비율은 색상의 R, G 또는 B 중 가장 큰 값과 가장 작은 값의 차이입니다.정의를 쉽게 쓸 수 있도록 이 최대, 최소 및 채도 성분 값을 각각 [H]M, m 및 C로 정의합니다.
채도가 M - m으로 표시될 수 있는 이유를 이해하려면 R = G = B인 모든 중성 색상이 원점에 투영되고 채도가 0인 점에 유의하십시오.따라서 R, G, B의 3개 모두에서 같은 양을 더하거나 빼면 기울어진 입방체 내에서 수직으로 이동하고 투영도는 변경되지 않습니다.따라서 (R, G, B)와 (R - m, G - m, B - m)의 두 가지 색상은 같은 점에 투영되어 채도가 같다.성분 중 하나가 0(m = 0)인 색상의 채도는 단순히 다른 두 성분의 최대값입니다.이 채도는 성분이 0인 특정 색상의 경우 M이고 일반적으로 M - m입니다.
색조는 투영 지점을 통과하는 육각 모서리 주변의 거리 비율이며, 원래는 [0, 1] 범위에서 측정되었지만 현재는 일반적으로 도[0°, 360°]로 측정된다.색도 평면(즉, 회색)의 원점에 투영되는 점의 경우 색조가 정의되지 않습니다.수학적으로 색상 정의는 다음과 같이 단편적으로 [I]작성됩니다.
때로는 표현 편의를 위해 중립 색상(즉, C = 0)에 0°의 색상을 할당하기도 한다.
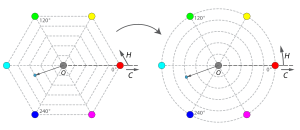
이러한 정의는 육각형의 기하학적 왜곡에 해당하며 육각형의 각 면이 원의 60° 호 위에 선형으로 매핑됩니다(그림 10).이러한 변환 후 색조는 원점 주위의 각도와 색도입니다. 원점으로부터의 거리: 색을 가리키는 벡터의 각도와 크기입니다.
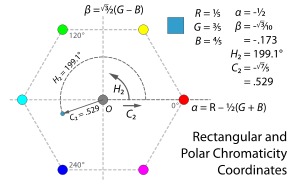
때때로 이미지 분석 애플리케이션의 경우, 이 육각형-원 변환을 건너뛰고 색상 및 채도(이러한2 H와2 C를 나타냅니다)는 일반적인 데카르트-극좌표 변환(그림 11)에 의해 정의됩니다.그것들을 도출하는 가장 쉬운 방법은 우리가 α와 [25][26][27]β라고 부르는 데카르트 색도 좌표 쌍을 사용하는 것이다.
('2-변수 아크탄젠트'인 atan2 함수는 데카르트 좌표 쌍으로부터 각도를 계산합니다.)
색상(H와2 H)의 이 두 가지 정의는 거의 일치하며, 약 1.12°의 색에 대한 색상 간의 최대 차이는 12개의 특정 색상(예: H = 13.38°)에서 발생한다.H2 = 12.26°—그리고 30°의 모든 배수에 대해 H2 = H이다.채도에 대한 두 가지 정의(C와2 C)는 더 실질적으로 다릅니다. 육각형 모서리에서는 동일하지만, H = H2 = 30°와 같이 두 모서리 사이의 중간 지점에서는 C = 1이지만, C2 = ¾ 0 0.866으로 약 13.4%의 차이를 보입니다.
가벼움
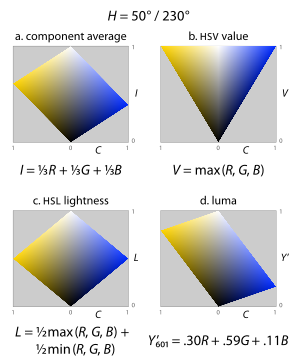
색조의 정의는 비교적 논란의 여지가 없지만(같은 인식 색조의 색상이 동일한 수치 색조를 가져야 한다는 기준을 대략 충족한다), 밝기 또는 가치 차원의 정의는 명확하지 않다. 표현의 목적과 목표에 따라 몇 가지 가능성이 있다.다음은 가장 일반적인 4가지입니다(그림 12). 이 중 3개는 그림에도 나와 있습니다. 8):
- 가장 간단한 정의는 강도라고 불리는 HSI 모델에서 세 가지 성분의 산술 평균, 즉 평균입니다(그림 12a).이것은 단순히 기울어진 큐브에 있는 점의 수직 높이인 중립 축에 점을 투영하는 것입니다.장점은 색상 및 채도의 유클리드 거리 계산과 함께 이 표현은 RGB [26][28]큐브의 기하학으로부터의 거리와 각도를 유지한다는 것입니다.
- HSV "헥스콘" 모델에서 값은 색상의 가장 큰 성분인 위의 M으로 정의됩니다(그림 12b).이렇게 하면 세 가지 원색 모두와 "두 번째 색"인 "두 번째 색"이 모두 흰색 평면에 배치되어 RGB [13]큐브에서 육각형 피라미드를 형성합니다.
- HSL "bi-hexcone" 모델에서 밝기는 가장 크고 작은 색 구성 요소의 평균(그림 12c), 즉 RGB 구성 요소의 중간 범위로 정의됩니다.이 정의에서는 원색과 보조색을 평면에 넣지만 흰색과 검은색의 중간을 지나는 평면을 사용합니다.결과적으로 생성되는 색상의 고체는 위에 나온 [14]Ostwald와 유사한 이중 원뿔입니다.
- 보다 지각적으로 관련성이 높은 대안은 루마, Y,를 명도 치수로 사용하는 것이다(그림 12d).Luma는 감마 보정 R, G, B의 가중 평균으로, 오랫동안 컬러 텔레비전 방송의 단색 차원으로 사용되었다.sRGB의 경우 Rec. 709 프라이머리 산출량 Y y,709 디지털 NTSC는 Rec. 601에 따라 601Y according를 사용하며 다른 프라이머리도 사용되고 있어 계수가 [29][J]다르다.
- 0.R +G + B( \ Y ' { \ { } } \R +\ G +\ B( SDTV )
- (Adobe)
- (HDTV)
- (UHDTV, HDR)
이 네 개 모두 중립축을 그대로 둡니다.즉, R = G = B인 색상의 경우, 네 가지 제제 중 어느 것이든 R, G 또는 B의 값과 같은 밝기를 산출한다.
그래픽 비교는 아래 그림 13을 참조하십시오.
포화도
색상/밝기/크로마 또는 색상/값/크로마 모델에서 색상을 인코딩할 때(앞의 두 섹션의 정의를 사용), 밝기(또는 값)와 채도의 모든 조합이 의미가 있는 것은 아닙니다.즉, H ∈[ 0 、 360 ], C [ [ 0 、 1 ], V [ [ 0 、 1 、 RGB the 1 、 0 、 0 、 0 、 0 、 0 、 0 、 0 、 0 、 0 、 0 、 0 、 0 the 0 the 0 the 0 the 0 the 0 the the 0 the 0 the 0 thegure 14).이러한 모델을 만든 사람들은 이것이 일부 용도에는 문제가 된다고 생각했습니다.예를 들어 직사각형에 2개의 치수와 슬라이더에 3개의 치수를 가진 색상 선택 인터페이스에서 해당 직사각형의 절반은 사용되지 않는 공간으로 구성됩니다.밝기를 나타내는 슬라이더가 있다고 가정해 봅시다.이 슬라이더를 조정할 때 사용자가 의도하는 바가 모호할 수 있습니다.소프트웨어는 가뮤트 범위를 벗어난 색상에 어떻게 대처해야 합니까?또는 반대로 사용자가 가능한 한 컬러풀한 보라색을 선택한 후 밝기 슬라이더를 위로 이동시킨 경우, 사용자는 주어진 색상과 밝기에 대해 가능한 한 컬러풀한 보라색을 보고 싶은가, 아니면 원래 [14]색상과 정확히 같은 채도의 밝은 보라색을 보고 싶은가?
이러한 문제를 해결하기 위해 HSL 및 HSV 모델은 색상과 밝기 또는 값의 모든 조합에 대해 항상 [0, 1] 범위에 맞도록 채도를 조정하고 두 경우 모두 새로운 속성 포화도를 호출합니다(그림 14).어느쪽인가를 계산하려면 , 그 값 또는 밝기의 최대 채도로 채도를 나눕니다.
H를 색상 치수로, 성분 평균 I("강도")를 밝기 치수로 하는 컴퓨터 비전에 일반적으로2 사용되는 HSI 모델은 채도의 정의에 따라 실린더를 "채우는" 시도를 하지 않습니다.HSI의 목적은 최종 사용자에게 색상 선택이나 수정 인터페이스를 제시하는 것이 아니라 이미지에서 형상을 쉽게 분리하는 것입니다.따라서 채도는 심리학적 정의인 밝기에 대한 채도에 따라 정의된다(그림 15).이 [31]문서의 "이미지 분석에서 사용" 섹션을 참조하십시오.
이 세 가지 다른 채도의 정의에 동일한 이름을 사용하면 세 가지 속성이 실질적으로 다른 색상 관계를 설명하므로 혼란이 발생합니다. HSV와 HSI에서 용어는 자신의 밝기에 상대적인 색채의 심리학적 정의와 대략 일치하지만 HSL에서는 근접하지 않습니다.심지어 채도라는 단어는 위의 채도(C 또는2 C)라고 하는 측정값 중 하나에 자주 사용됩니다.
예
아래에 표시된 모든 매개변수 값은 [0°, 360°][K] 구간에 있는 H와2 H를 제외하고 백분율(인자 100에 의해 스케일링된 구간 [0, 1])로 지정됩니다.
| 색. | ★★ | » | 로마 | ★★ | ★★★ | 도 ★★★★ | ||||||||
|---|---|---|---|---|---|---|---|---|---|---|---|---|---|---|
| R | G | B | H | H2 | C | C2 | V | L | I | Y★601 | SV | SL | SI | |
white | 100% | 100% | 100% | 0% | 100% | 100% | 100% | 100% | 0% | |||||
#808080 | 50% | 50% | 50% | 0% | 50% | 50% | 50% | 50% | 0% | |||||
black | 0% | 0% | 0% | 0% | 0% | 0% | 0% | 0% | 0% | |||||
red | 100% | 0% | 0% | 0° | 100% | 100% | 50% | 33.3% | 29.9% | 100% | ||||
#BFBF00 | % 75 % | % 75 % | 0% | 60° | % 75 % | % 75 % | 37.5% | 50% | 66.4% | 100% | ||||
#008000 | 0% | 50% | 0% | 120° | 50% | 50% | % 25 % | 16.7% | 29.3% | 100% | ||||
#80FFFF | 50% | 100% | 100% | 180° | 50% | 100% | % 75 % | 83.3% | 85% | 50% | 100% | % 40 % | ||
#8080FF | 50% | 50% | 100% | 240° | 50% | 100% | % 75 % | 66.7% | 55.7% | 50% | 100% | % 25 % | ||
#BF40BF | % 75 % | % 25 % | % 75 % | 300° | 50% | % 75 % | 50% | 58.3% | 45.7% | 66.7% | 50% | |||
#A0A424 | 62.8% | 64.3% | 14.2% | 61.8° | 61.5° | 49.4% | 64.3% | 39.3% | 47.1% | 58.1% | 77.9% | 63.8% | 69.9% | |
#411BEA | 25.5% | 10.4% | 91.8% | 251.1° | 250° | 81.4% | % 75 % | 91.8% | 51.1% | 42.6% | 24.2% | 88.7% | 83.2% | 75.6% |
#1EAC41 | 67.5% | 25.5% | 134.9° | 133.8° | 55.9% | 67.5% | 39.6% | 34.9% | 46% | 82.8% | 70.7% | 66.7% | ||
#F0C80E | 94.1% | 78.5% | 5.3% | 49.5° | 50.5° | 88.8% | 82.1% | 94.1% | 49.8% | 59.3% | 74.8% | 94.4% | 89.3% | 91.1% |
#B430E5 | 18.7% | 89.7% | 283.7° | 284.8° | % 71 % | 63.6% | 89.7% | 54.3% | 59.6% | 42.3% | 79.2% | 77.5% | 68.6% | |
#ED7651 | 93.1% | 46.3% | 31.6% | 14.3° | 13.2° | 61.5% | 55.6% | 93.1% | 62.4% | 57% | 58.6% | 66.1% | 81.7% | 44.6% |
#FEF888 | 99.8% | 97.4% | 53.2% | 56.9° | 57.4° | 46.6% | 45.4% | 99.8% | 76.5% | 83.5% | 93.1% | 46.7% | 99.1% | 36.3% |
#19CB97 | 9.9% | 79.5% | 59.1% | 162.4° | 163.4° | 69.6% | % 62 % | 79.5% | 44.7% | 49.5% | 56.4% | 87.5% | 77.9% | 80% |
#362698 | 21.1% | 14.9% | 59.7% | 248.3° | 247.3° | 44.8% | % 42 % | 59.7% | 37.3% | 31.9% | 21.9% | % 75 % | 60.1% | 53.3% |
#7E7EB8 | 49.5% | 49.3% | 72.1% | 240.5° | 240.4° | 22.8% | 22.7% | 72.1% | 60.8% | 57% | % 52 % | 31.6% | % 29 % | 13.5% |
사용자 에서 사용
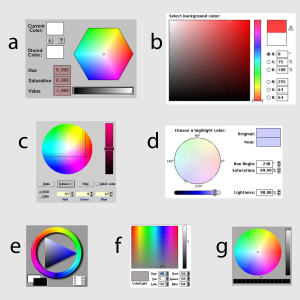
· (a) SGI IRIX 5, c. 1995;
· (b) Adobe Photoshop, c. 1990;
· (c) IBM OS/2 Warp 3, c. 1994;
· (d) Apple Macintosh System 7, c. 1996;
· (e) 프랙탈 디자인 페인트, c. 1993
· (f) Microsoft Windows 3.1, c. 1992;
· (g) NextSTEP, c. 1995.
이는 [L]1970년대 중반 PARC와 NYIT까지 거슬러 올라가는 이전의 예에 기초한 것이 분명하다.
HSL 및 HSV 및 이와 유사한 모델의 원래 목적과 가장 일반적인 현재 적용 분야는 색상 선택 도구입니다.간단히 말해, 이러한 컬러 피커는 각 속성별로 하나씩 3개의 슬라이더를 제공합니다.그러나 대부분의 경우 모델을 통해 2차원 슬라이스와 함께 표시되는 특정 슬라이스를 제어하는 슬라이더가 표시됩니다.후자의 GUI 타입은 모델이 제안하는 실린더, 육각형 프리즘 또는 원뿔/바이콘 중에서 선택할 수 있기 때문에 매우 다양합니다(페이지 상단 그림 참조).1990년대의 여러 가지 색상 선택기가 오른쪽에 표시되어 있으며, 그 중 대부분은 그 사이에 거의 변경되지 않았습니다. 오늘날 거의 모든 컴퓨터 색상 선택기는 적어도 옵션으로 HSL 또는 HSV를 사용합니다.보다 정교한 변종 중 일부는 HSL 또는 HSV 관계에 따라 호환되는 색상을 제안하여 전체 색상 세트를 선택하도록 설계되어 있습니다.[M]
색상 선택이 필요한 대부분의 웹 애플리케이션은 HSL 또는 HSV를 기반으로 하며, 대부분의 주요 웹 프런트 엔드 프레임워크에 사전 패키지화된 오픈 소스 색상 선택 기능이 있습니다.CSS 3 사양에서는 웹 작성자가 HSL [N][32]좌표를 사용하여 페이지의 색상을 직접 지정할 수 있습니다.
HSL 및 HSV는 지도 또는 의료 영상과 같이 데이터 시각화를 위한 구배를 정의하는 데 사용되기도 한다.예를 들어, 인기 있는 GIS 프로그램 ArcGIS는 역사적으로 맞춤형 HSV 기반 구배를 수치 지리 [O]데이터에 적용했습니다.
그림 17. xv의 HSV 기반 색상 수식자. | 그림 18Photoshop 2.5, 1992년 경의 색상/포화 도구. |
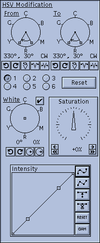
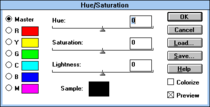
이미지 편집 소프트웨어에는 일반적으로 HSL 또는 HSV 좌표를 참조하거나 위에서 정의한 "명암" 또는 "루마"에 기반한 모델의 좌표를 기준으로 색상을 조정하는 도구도 포함되어 있습니다.특히, 적어도 1980년대 후반까지 거슬러 올라가는 "휴"와 "포화" 슬라이더가 한 쌍인 공구가 일반적이지만, 보다 복잡한 다양한 색 도구도 구현되었습니다.예를 들어 Unix 이미지 뷰어 및 컬러 에디터 xv는 6개의 사용자 정의 색상(H) 범위를 회전 및 크기 조정할 수 있으며, 여기에는 포화(SHSV)를 위한 다이얼 모양 제어와 값(V) 제어를 위한 곡선 모양 인터페이스가 포함된다(그림 17 참조).이미지 에디터 Picture Window Pro에는 HSL 또는 HSV [P]공간을 기준으로 색상/채도 평면에서 포인트를 복잡하게 재매핑할 수 있는 "색 보정" 도구가 포함되어 있습니다.
비디오 에디터도 이러한 모델을 사용합니다.예를 들어 Avid와 Final Cut Pro는 모두 HSL 또는 비디오에서 색상을 조정하기 위한 유사한 지오메트리를 기반으로 한 컬러 도구를 포함합니다.Avid 도구를 사용하면 색상/채도 원 내의 점을 클릭하여 벡터를 선택하고 밝기 수준(섀도, 중간 톤, 하이라이트)의 모든 색상을 해당 벡터에 따라 이동할 수 있습니다.
버전 4.0 이후 Adobe Photoshop의 "Luminity", "Hue", "Saturation" 및 "Color" 혼합 모드는 Luma/chroma/Hue 컬러 지오메트리를 사용하여 복합 레이어 모드입니다.이것들은 널리 복사되고 있지만, 몇몇 모방자들은 대신 HSL(PhotoImpact, Paint Shop Pro) 또는 HSV 지오메트리를 [Q][R]사용합니다.
HSL, HSV, HSI 또는 관련 모델은 피쳐 검출 또는 이미지 분할을 위한 컴퓨터 비전 및 이미지 분석에 자주 사용됩니다.이러한 도구의 응용 프로그램에는 예를 들어 로봇 시각에서 물체 감지, 얼굴, 텍스트 또는 번호판 등의 물체 인식, 컨텐츠 기반 이미지 검색 및 의료 [31]이미지 분석이 포함됩니다.
대부분의 경우 컬러 이미지에 사용되는 컴퓨터 비전 알고리즘은 k-평균, 픽셀 색상의 퍼지 클러스터링, 캐니 에지 검출 등 그레이스케일 이미지를 위해 설계된 알고리즘에 대한 간단한 확장입니다.가장 간단하게는 각 색성분이 같은 알고리즘을 개별적으로 통과한다.따라서 관심 있는 특징이 사용된 색 치수에 따라 구별될 수 있는 것이 중요합니다.디지털 화상 중 물체 색상의 R, G, B 성분은 모두 물체에 부딪히는 빛의 양과 상관관계가 있기 때문에 이들 성분의 화상 기술은 물체 식별을 어렵게 한다.색상/밝기/색종 또는 색상/밝기/포화도의 측면에서 설명은 종종 [31]더 관련이 있다.
1970년대 후반부터 HSV 또는 HSI와 같은 변환은 세분화의 효율성과 계산 복잡성 사이의 타협으로 사용되었습니다.그들은 특별히 동의하지 않고 인간의 색각에서 사용되는 신경 처리와 접근법과 의도가 비슷하다고 생각할 수 있다: 만약 목표가 물체 감지라면, 색상, 밝기, 채도 또는 채도를 대략적으로 구분하는 것이 효과적이지만, 인간의 색 반응을 엄격하게 모방할 특별한 이유는 없다.존 켄더의 1976년 석사 논문은 HSI 모델을 제안했다.Ohta 등(1980년)은 대신 I, α 및 β라고 부르는 것과 유사한 차원으로 구성된 모델을 사용했다.최근 몇 년 동안 이러한 모델은 더 복잡한 모델에 비해 성능이 우수하고 계산 단순성이 여전히 [S][31][39][40][41]매력적이기 때문에 널리 사용되고 있습니다.
★★★★
HSL, HSV 및 관련 공간은 예를 들어 단일 색상을 선택할 수 있을 만큼 충분히 기능하지만 색상의 복잡성은 대부분 무시합니다.기본적으로 컴퓨팅 역사(고급 1970년대 그래픽 워크스테이션 또는 1990년대 중반 소비자용 데스크톱)의 시대부터 계산 [T]속도에 대한 지각적 관련성을 교환합니다.
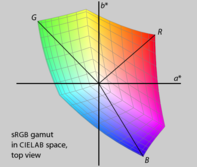
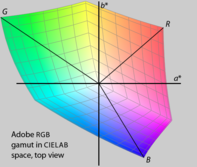
HSL과 HSV는 RGB의 단순한 변환으로, RGB의 R, G, B의 모서리가 중립축에서 등거리이고 둘레에서 등간격으로 유지되도록 인간의 지각과 무관한 RGB 큐브 내의 대칭을 유지합니다.CILAB(아래 참조)와 같이 지각적으로 균일한 공간에 RGB 영역을 표시하면 빨강, 초록, 파랑의 프라이머리에는 같은 밝기, 채도, 균일한 간격의 색조가 없는 것이 즉시 명확해집니다.또, RGB 디스플레이 마다 사용하는 프라이머리도 다르기 때문에, 영역도 다릅니다.HSL과 HSV는 일부 RGB 공간에 대해서만 정의되기 때문에 절대 색공간이 아닙니다.색상을 지정하려면 HSL 또는 HSV 값뿐만 아니라 사용 중인 감마 보정을 포함한 RGB 공간의 특성도 정확하게 보고해야 합니다.
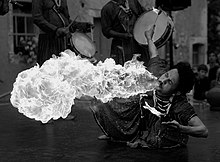
이미지를 추출하여 색상, 포화도, 밝기 또는 값 성분을 추출한 후 색 과학자가 정의한 것과 같은 이름의 성분과 비교하면 그 차이를 지각적으로 빠르게 알 수 있습니다.예를 들어, 화재 브리더의 다음 이미지를 조사합니다(그림 13).원본은 sRGB 색 공간에 있습니다.CIELAB L*은 CIE에서 정의된 무채색 휘도 양(sRGB 색공간 자체가 도출되는 CIEXYZ 색공간의 혼합색 성분 X 또는 Z에 의존하지 않고)이며, 이는 원래 색상과 유사한 색채색으로 보입니다.Luma는 대략 비슷하지만 높은 채도에서 다소 다릅니다. 즉, 진정한 무채색 휘도(Y 또는 동등한 L*)에만 의존하는 것에서 가장 많이 벗어나며 CILAB의 색도(x, y 또는 동등한 a*, b*)의 영향을 받습니다.반면 HSL L과 HSV V는 지각적 밝기에서 크게 벗어난다.
이러한 공간의 어떤 차원도 그들의 지각적 유사점과 일치하지 않지만, HSV의 가치와 HSL의 포화도는 특별한 범죄자들이다.HSV에서는 파란색 프라이머리와 흰색의 휘도는 지각적으로 약 10%이지만 파란색 프라이머리와 흰색은 동일한 값을 가집니다(정확한 비율은 사용 중인 특정 RGB 프라이머리에 따라 다름).HSL에서는 기존의 사이코메트릭 정의에서는 색도나 채도가 거의 없지만 100% 빨강, 100% 초록, 90% 파랑의 혼합(매우 연한 노랑)은 녹색 프라이머리와 같은 채도를 가진다.이러한 변태로 인해 지도와 정보 표시의 색상표 선택 전문가인 Cynthia Brewer는 미국 통계 협회에 다음과 같이 말했다.
컴퓨터 과학은 HSV나 HLS와 같은 소프트웨어 인터페이스에서도 나타날 수 있는 이러한 지각적 공간에 소수의 가난한 친척을 제공합니다.그것들은 RGB의 쉬운 수학적 변환이며 색상-밝기/값 포화 용어를 사용하기 때문에 지각 시스템인 것처럼 보인다.하지만 잘 보세요. 속지 마세요.지각 색 치수는 이러한 시스템 및 기타 시스템에서 제공되는 색 사양에 따라 적절히 조정되지 않습니다.예를 들어 채도와 밝기가 혼동되므로 채도 척도는 광범위한 밝기를 포함할 수 있습니다(예를 들어 밝기와 채도의 조합인 흰색에서 녹색으로 진행될 수 있습니다).마찬가지로 색상 및 밝기를 혼동하여 예를 들어 포화 노란색과 포화 파란색은 동일한 '밝기'로 지정될 수 있지만 인식 밝기에는 큰 차이가 있다.이러한 결함으로 인해 시스템을 사용하여 체계적인 방식으로 색 구성표 모양을 제어하기가 어렵습니다.원하는 효과를 얻기 위해 많은 조정이 필요한 경우, 시스템은 RGB 또는 [42]CMY의 원시 사양과 씨름하는 것보다 이점을 거의 제공하지 않습니다.
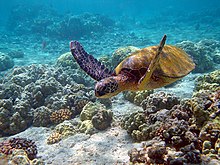
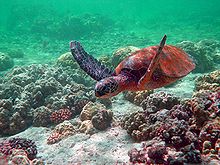
이러한 문제로 인해 HSL 및 HSV가 색상 또는 색상표 선택에 문제가 되면 이미지 조정에 문제가 생깁니다.HSL과 HSV는 Brewer가 언급한 바와 같이 지각 발색 속성을 혼동하여 차원을 변경하면 3가지 지각 차원 모두에 불균일한 변화가 발생하고 이미지 내의 모든 색상 관계가 왜곡됩니다.예를 들어, 순수한 짙은 파란색의 색상을 녹색으로 회전시키면 색도도 저하되고, 밝기도 증가하지만(후자는 더 회색이고 더 밝다), 같은 색상 회전은 밝은 청록색-녹색의 밝기와 채도(후자는 더 화려하고 약간 어둡다)와 반대 영향을 미칩니다.아래의 예(그림 21)에서는 왼쪽(a)의 화상이 녹색거북의 원본 사진이다.중간 이미지(b)에서는 HSV 값과 포화도 또는 HSL 밝기와 포화도를 일정하게 유지하면서 각 색상의 색상(H)을 -30° 회전시켰습니다.오른쪽 (c) 이미지에서는 각 색상의 HSL/HSV 색상에 대해 동일한 회전을 실시하지만 CILAB 밝기(L*, 인식 밝기의 적절한 근사치)는 일정하게 유지합니다.이러한 보정이 없는 색조 전환 중간 버전은 이미지에서 색상 간의 인식된 밝기 관계를 크게 변화시킵니다.특히 거북의 등껍질은 훨씬 진하고 대비가 덜하며, 뒷물도 훨씬 가볍다.
색조는 360°에서 불연속적으로 수치로 표현되는 원형 양이기 때문에 통계 계산이나 정량적 비교에 사용하기 어렵다. 분석에는 원형 [43]통계를 사용해야 한다.또한 색조는 60° 청크로 구분하여 정의되며, R, G, B에 대한 밝기, 값 및 채도의 관계는 해당 색 청크에 따라 달라집니다.이 정의는 HSL 또는 [44]HSV의 수평 슬라이스에서 쉽게 볼 수 있는 단절을 도입한다.
디지털 비디오 전문가인 Charles Poynton은 컬러 FAQ에서 HSL과 HSV에 관한 위의 문제를 나열하고 다음과 같이 결론짓습니다.
HSB와 HLS는 사용자가 색상을 수치로 지정해야 하는 시대에 색상, 채도 및 밝기(또는 색상, 밝기 및 채도)를 지정하기 위해 개발되었습니다.HSB와 HLS의 일반적인 공식은 색각의 특성과 관련하여 결함이 있습니다.이제 사용자는 시각적으로 색상을 선택하거나 다른 미디어(PANTONE 등)와 관련된 색상을 선택하거나 L*u*v*나 L*a*b*와 같은 지각 기반 시스템을 사용할 수 있게 되었습니다.HSB나 HLS는 [45]포기해야 합니다.
기타 원통 좌표 색상 모델
HSL과 HSV의 창시자들은 원추형이나 구형에 맞는 색을 상상한 최초의 사람은 아니다. 중심축은 흑색에서 백색으로, 그리고 그 축 주위의 각도에 대응하는 색조를 가지고 있다.유사한 배열은 18세기까지 거슬러 올라가며, 가장 현대적이고 과학적인 모형으로 계속 개발되고 있다.
색변환 공식
HSL 또는 HSV에서 RGB로 변환하려면 위에서 설명한 절차를 기본적으로 반전합니다(이전처럼 R, G, B [ [ 0 , 1 ] ) 。첫째, 주어진 밝기 또는 값에 대한 최대 채도를 곱하여 채도를 계산합니다.다음으로 색상과 채도가 같은 RGB 큐브의 아래쪽 세 면 중 하나에서 점을 찾습니다(따라서 색도 평면의 같은 점에 투영됩니다).마지막으로 R, G, B를 동일하게 가하여 적절한 밝기 또는 [G]값에 도달합니다.
RGB로
HSL에서 RGB로
색상 H [ [ 0 ° , 360 ° ], 포화L S 0 [ 0 , 1 ] 및 밝기 L [ [ 0 , 1 ]의 색상이 주어지면 먼저 채도를 찾습니다.
다음으로 색상과 채도가 같은 RGB 큐브의 아래쪽 세 면을 따라 점(R1, G1, B1)을 찾을 수 있습니다(이 색상의 두 번째로 큰 컴포넌트에 중간값 X 사용).
위의 식에서 H 2(\ H는 유클리드 나눗셈 {\ Hprime}}의 나머지를 2로 나타낸다.H \ H^ { \ prime} )는 반드시 정수는 아닙니다.
H { \ H^ { \ } 、 X \ X =) 、 ( \ X 와 같은 결과가 됩니다.
마지막으로 각 성분에 같은 양을 더해 R, G, B를 찾을 수 있습니다.
HSL에서 RGB로 대체
다각형 부분 함수는 최소값과 최대값을 교묘하게 사용하고 나머지 연산을 통해 다소 단순화할 수 있습니다.
H [ , 360display]{ [ 0 ^ \ } , ^ { \ }, 포화 S L [ , S _ S { [ 0 , ], l 의 이 지정되었을 경우, 1.
서 k, R0 \ k , \ \ { } { \ 0 } 입니다.
출력 R, G, B 값([ {{]^{부터은 다음과 같습니다.
위의 대체식을 사용하면 구현 시간을 단축할 수 있습니다.위의 공식에서 b({ {b 에서도 모듈의 소수 부분이 됩니다: .4 1. {6} 1. k [ , ]({ k
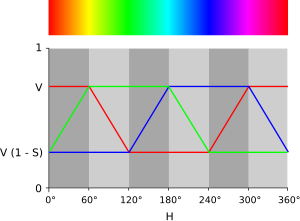
베이스 T ( -,- ,),-)({ TH)=\ 는 과 같이 구성됩니다.nt는 k=6입니다. 다음 t 2 ( 1,) min ( -, - ,) { t _ {2} = \( t1} ) = \( k - 3 - k , ) } 1 1 、 1 1 、 1 。그런 다음 t ( 2, -) {\ t=\만큼 -1 미만의 값을 -1로 변경합니다.이 때 수직 플립 후 그림 24에서 빨간색 모양과 유사한 것을 얻을 수 있습니다(최대값은 1, 최소값은 -1).H H의 R,G,B 함수는(\ X\Y Y)(\display style Y)(\display style Y)(\display style 의 R,G,B(\display style Y)(\ Y의 스케일링에 다릅니다.
다음과 같은 형상 특성을 관찰한다(그림 24는 직관을 얻는 데 도움이 된다).
HSV에서 RGB로
색상 H≤ [0°, 360°], 포화도V S≤ [0, 1], 값 V≤ [0, 1]의 HSV 색상이 주어지면 동일한 전략을 사용할 수 있습니다.먼저 채도를 찾습니다.
그런 다음 RGB 큐브의 아래쪽 3면을 따라 색상 및 채도가 같은 점(R1, G1, B)을1 찾을 수 있습니다(이 색상의 두 번째로 큰 컴포넌트에 중간값 X 사용).
이전과 같이 H {\ H}}이 정수일 "네이버링" 공식도 같은 결과를 얻을 수 있습니다.
마지막으로 각 컴포넌트에 같은 양을 추가하여 R, G 및 B를 찾을 수 있습니다.
HSV에서 RGB로 대체
H [ , 360display]{ [ 0 ^ \ } , ^ { \ }, 포화 S V [ , S { V }\ , }, 및 값 [ 1 의 색상이 지정되면, 1]가 됩니다.
where and:
And output R,G,B values (from ) are:
Above alternative equivalent formulas allow shorter implementation. In above formulas the returns also fractional part of module e.g. the formula . The values of . The base shape
is constructed as follows: is "triangle" for which non-negative values starts from k=0, highest point at k=2 and "ends" at k=4, then we change values bigger than one to one by , then change negative values to zero by – and we get (for ) something similar to green shape from Fig. 24 (which max value is 1 and min value is 0). The R,G,B functions of use this shape transformed in following way: modulo-shifted on (by ) (differently for R,G,B) scaled on (by ) and shifted on (by ). We observe following shape properties(Fig. 24 can help to get intuition about this):
HSI to RGB
Given an HSI color with hue H ∈ [0°, 360°], saturation SI ∈ [0, 1], and intensity I ∈ [0, 1], we can use the same strategy, in a slightly different order:
Where is the chroma.
Then we can, again, find a point (R1, G1, B1) along the bottom three faces of the RGB cube, with the same hue and chroma as our color (using the intermediate value X for the second largest component of this color):
Overlap (when is an integer) occurs because two ways to calculate the value are equivalent: or , as appropriate.
Finally, we can find R, G, and B by adding the same amount to each component, to match lightness:
Luma, chroma and hue to RGB
Given a color with hue H ∈ [0°, 360°], chroma C ∈ [0, 1], and luma Y′601 ∈ [0, 1],[U] we can again use the same strategy. Since we already have H and C, we can straightaway find our point (R1, G1, B1) along the bottom three faces of the RGB cube:
Overlap (when is an integer) occurs because two ways to calculate the value are equivalent: or , as appropriate.
Then we can find R, G, and B by adding the same amount to each component, to match luma:
Interconversion
HSV to HSL
Given a color with hue , saturation , and value ,
HSL to HSV
Given a color with hue , saturation , and luminance ,
From RGB
This is a reiteration of the previous conversion.
Value must be in range .
With maximum component (i. e. value)
and minimum component
- ,
range (i. e. chroma)
and mid-range (i. e. lightness)
- ,
we get common hue:
and distinct saturations:
Swatches
Mouse over the swatches below to see the R, G, and B values for each swatch in a tooltip.
HSL
|
| ||||||||||||||||||||||||||||||||||||||||||||||||||||||||||||||||||||||||||||||||||||||||||||||||||||||||||||||||||||||||||||||||||||||||||||||||||||||||||||||||||||||||||||||||||||||||||||||||||||||||||||||||||||||||||||
|
| ||||||||||||||||||||||||||||||||||||||||||||||||||||||||||||||||||||||||||||||||||||||||||||||||||||||||||||||||||||||||||||||||||||||||||||||||||||||||||||||||||||||||||||||||||||||||||||||||||||||||||||||||||||||||||||
|
| ||||||||||||||||||||||||||||||||||||||||||||||||||||||||||||||||||||||||||||||||||||||||||||||||||||||||||||||||||||||||||||||||||||||||||||||||||||||||||||||||||||||||||||||||||||||||||||||||||||||||||||||||||||||||||||
HSV
|
| ||||||||||||||||||||||||||||||||||||||||||||||||||||||||||||||||||||||||||||||||||||||||||||||||||||||||||||||||||||||||||||||||||||||||||||||||||||||||||||||||||||||||||||||||||||||||||||||||||||||||||||||||||||||||||||
|
| ||||||||||||||||||||||||||||||||||||||||||||||||||||||||||||||||||||||||||||||||||||||||||||||||||||||||||||||||||||||||||||||||||||||||||||||||||||||||||||||||||||||||||||||||||||||||||||||||||||||||||||||||||||||||||||
|
| ||||||||||||||||||||||||||||||||||||||||||||||||||||||||||||||||||||||||||||||||||||||||||||||||||||||||||||||||||||||||||||||||||||||||||||||||||||||||||||||||||||||||||||||||||||||||||||||||||||||||||||||||||||||||||||
See also
Notes
- ^ The Joblove and Greenberg (1978) paper first introducing HSL, they called HSL lightness "intensity", called HSL saturation "relative chroma", called HSV saturation "saturation" and called HSV value "value". They carefully and unambiguously described and compared three models: hue/chroma/intensity, hue/relative chroma/intensity, and hue/value/saturation. Unfortunately, later authors were less fastidious, and current usage of these terms is inconsistent and often misleading.
- ^ The name hexcone for hexagonal pyramid was coined in Smith (1978), and stuck.
- ^ For instance, a 1982 study by Berk, et al., found that users were better at describing colors in terms of HSL than RGB coordinates, after being taught both systems, but were much better still at describing them in terms of the natural-language CNS model (which uses names such as "very dark grayish yellow-green" or "medium strong bluish purple"). This shouldn't be taken as gospel however: a 1987 study by Schwarz, et al., found that users could match colors using RGB controls faster than with HSL controls; a 1999 study by Douglas and Kirkpatrick found that the visual feedback in the user interface mattered more than the particular color model in use, for user matching speed.[10][11][12]
- ^ "Clearly, if color appearance is to be described in a systematic, mathematical way, definitions of the phenomena being described need to be precise and universally agreed upon."[19]
- ^ In Levkowitz and Herman’s formulation, R, G, and B stand for the voltages on the guns of a CRT display, which might have different maxima, and so their cartesian gamut could be a box of any unequal dimensions. Other definitions commonly use integer values in the range [0, 255], storing the value for each component in one byte. We define the RGB gamut to be a unit cube for convenience because it simplifies and clarifies the math. Also, in general, HSL and HSV are today computed directly from gamma-corrected R′, G′, and B′—for instance in sRGB space—but, when the models were developed, might have been transformations of a linear RGB space. Early authors don’t address gamma correction at all, except Alvy Ray Smith[13] who clearly states that "We shall assume that an RGB monitor is a linear device", and thus designed HSV using linear RGB. We will drop the primes, and the labels R, G, and B should be taken to stand for the three attributes of the origin RGB space, whether or not it is gamma corrected.
- ^ Using the chroma here not only agrees with the original Joblove and Greenberg (1978) paper, but is also in the proper spirit of the psychometric definition of the term. Some models call this attribute saturation—for instance Adobe Photoshop's "Saturation" blend mode—but such use is even more confusing than the use of the term in HSL or HSV, especially when two substantially different definitions are used side by side.
- ^ a b Most of the computer graphics papers and books discussing HSL or HSV have a formula or algorithm describing them formally. Our formulas which follow are some mix of those. See, for instance, Agoston (2005) or Foley (1995)
- ^ Hanbury and Serra (2002) put a great deal of effort into explaining why what we call chroma here can be written as max(R, G, B) − min(R, G, B), and showing that this value is a seminorm. They reserve the name chroma for the Euclidean norm in the chromaticity plane (our C2), and call this hexagonal distance saturation instead, as part of their IHLS model
- ^ In the following, the multiplication of hue by 60°—that is, 360°/6—can be seen as the hexagonal-geometry analogue of the conversion from radians to degrees, a multiplication by 360°/2π: the circumference of a unit circle is 2π; the circumference of a unit hexagon is 6.
- ^ For a more specific discussion of the term luma, see Charles Poynton (2008). See also RGB color space#Specifications. Photoshop exclusively uses the NTSC coefficients for its "Luminosity" blend mode regardless of the RGB color space involved.[30]
- ^ The first nine colors in this table were chosen by hand, and the last ten colors were chosen at random.
- ^ See Smith (1978). Many of these screenshots were taken from the GUIdebook, and the rest were gathered from image search results.
- ^ For instance, a tool in Illustrator CS4, and Adobe's related web tool, Kuler, both allow users to define color schemes based on HSV relationships, but with a hue circle modified to better match the RYB model used traditionally by painters. The web tools ColorJack, Color Wizard, and ColorBlender all pick color schemes with reference to HSL or HSV.
- ^ Try a web search for "[framework name] color picker" for examples for a given framework, or "JavaScript color picker" for general results.
- ^ ArcGIS calls its map-symbol gradients "color ramps". Current versions of ArcGIS can use CIELAB instead for defining them.[33]
- ^ For instance, the first version of Photoshop had an HSL-based tool; see "Photoshop hue/saturation" in the GUIdebook for screenshots.[34][35]
- ^ Photoshop's documentation explains that, e.g., "Luminosity: Creates a result color with the hue and saturation of the base color and the luminance of the blend color."[36]
- ^ The HSL-style mode (with a Rec. 601 Luminosity) are also standardized in CSS from a documentation contributed by Adobe and Canon.[37] GIMP 2.10 has switched to LCH(ab) from its older HSV geometry.[38]
- ^ The Ohta et al. model has parameters I1 = (R + G + B)/3, I2 = (R − B)/2, I3 = (2G − R − B)/4. I1 is the same as our I, and I2 and I3 are similar to our β and α, respectively, except that (a) where α points in the direction of R in the "chromaticity plane", I3 points in the direction of G, and (b) the parameters have a different linear scaling which avoids the √3 of our β.
- ^ Most of the disadvantages below are listed in Poynton (1997), though as mere statements, without examples.
- ^ Some points in this cylinder fall out of gamut.
References
- ^ "HSL Colors". CSS Color Module Level 4 (Working draft). World Wide Web Consortium. Retrieved 27 January 2022.
- ^ Ihaka R, Murrell P, Hornik K, Fisher JC, Stauffer R, Wilke CO, McWhite CD, Zeileis A. Color Spaces: S4 Classes and Utilities. R Project: colorspace package (Article). Retrieved 27 January 2022.
- ^ Ottosson, Björn (8 September 2021). "Okhsv and Okhsl" (Blog post). GitHub. Retrieved 27 January 2022.
- ^ FR patent 841335, Valensi, Georges, "Procédé de télévision en couleurs", published 1939-05-17, issued 1939-02-06
- ^ US patent 2375966, Valensi, Georges, "System of television in colors", published 1945-05-15
- ^ a b Levkowitz and Herman (1993)
- ^ Wilhelm Ostwald (1916). Die Farbenfibel. Leipzig.
- ^ Wilhelm Ostwald (1918). Die Harmonie der Farben. Leipzig.
- ^ US patent 4694286, Bergstedt, Gar A., "Apparatus and method for modifying displayed color images", published 1987-09-15, assigned to Tektronix, Inc
- ^ Toby Berk; Arie Kaufman; Lee Brownston (August 1982). "A human factors study of color notation systems for computer graphics". Communications of the ACM. 25 (8): 547–550. doi:10.1145/358589.358606. S2CID 14838329.
- ^ Michael W. Schwarz; William B. Cowan; John C. Beatty (April 1987). "An experimental comparison of RGB, YIQ, LAB, HSV, and opponent color models". ACM Transactions on Graphics. 6 (2): 123–158. doi:10.1145/31336.31338. S2CID 17287484.
- ^ Sarah A. Douglas; Arthur E. Kirkpatrick (April 1999). "Model and representation: the effect of visual feedback on human performance in a color picker interface". ACM Transactions on Graphics. 18 (2): 96–127. doi:10.1145/318009.318011. S2CID 14678328.
- ^ a b c d Smith (1978)
- ^ a b c d Joblove and Greenberg (1978)
- ^ Maureen C. Stone (August 2001). "A Survey of Color for Computer Graphics". Course at SIGGRAPH 2001.
- ^ Ware Myers (July 1979). "Interactive Computer Graphics: Flying High-Part I". Computer. 12 (7): 8–17. doi:10.1109/MC.1979.1658808. S2CID 15344162.
- ^ N. Magnetat-Thalmann; N. Chourot; D. Thalmann (March 1984). "Colour Gradation, Shading and Texture Using a Limited Terminal". Computer Graphics Forum. 3: 83–90. doi:10.1111/j.1467-8659.1984.tb00092.x. S2CID 29541525.
- ^ Computer Graphics Staff (August 1979). "Status Report of the Graphics Standards Planning Committee". ACM SIGGRAPH Computer Graphics. 13 (3): 1–10. doi:10.1145/988497.988498. S2CID 43687764.
- ^ a b c d e f g h Fairchild (2005), pp. 83–93
- ^ Kuehni (2003)
- ^ Standard Terminology of Appearance E284. ASTM. 2009.
- ^ International Lighting Vocabulary (4th ed.). CIE and IEC. 1987. ISBN 978-3-900734-07-7. Archived from the original on 2010-02-27. Retrieved 2010-02-05.
- ^ Poynton (1997)
- ^ Sharma, G. (2003). Digital Color Imaging Handbook. Boca Raton, FL: CRC Press. ISBN 978-0-8493-0900-7.
- ^ Hanbury and Serra (2002)
- ^ a b Hanbury (2008)
- ^ Patrick Lambert; Thierry Carron (1999). "Symbolic fusion of luminance-hue-chroma features for region segmentation". Pattern Recognition. 32 (11): 1857. doi:10.1016/S0031-3203(99)00010-2.
- ^ Rafael C. Gonzalez and Richard Eugene Woods (2008). Digital Image Processing, 3rd ed. Upper Saddle River, NJ: Prentice Hall. ISBN 0-13-168728-X. pp. 407–413.
- ^ Poynton (1997). "What weighting of red, green and blue corresponds to brightness?"
- ^ Bruce Lindbloom (2001-09-25). http://lists.apple.com/archives/colorsync-users/2001/Sep/msg00488.html "Re: Luminosity channel...".
- ^ a b c d Cheng et al. (2001)
- ^ Tantek Çelik, Chris Lilley, and L. David Baron (July 2008). "CSS3 Color Module Level 3".
- ^ "Working with color ramps". Environmental Systems Research Institute. January 2008. Retrieved August 30, 2017.
- ^ Bradley, John (1994). "The HSV Modification Tools". John's World of XV and Other Cool Stuff.
- ^ Sinkel, Kiril (January 2010). "User Guide for Picture Window and Picture Window Pro Digital Light & Color" (PDF). Archived from the original (PDF) on 2014-05-12.
- ^ "Blending Modes". Photoshop User Guide. Adobe Systems Incorporated. February 15, 2017.
- ^ "Compositing and Blending Level 1". www.w3.org.
- ^ "GIMP's LCH Blend Modes". Nine Degrees Below.
- ^ John Kender (1976). "Saturation, hue and normalized color". Carnegie Mellon University, Computer Science Dept. Pittsburgh, PA.
- ^ Yu-Ichi Ohta; Takeo Kanade; Toshiyuki Sakai (1980). "Color information for region segmentation". Computer Graphics and Image Processing. 13 (3): 222. doi:10.1016/0146-664X(80)90047-7.
- ^ Ffrank Perez; Christof Koch (1994). "Toward color image segmentation in analog VLSI: Algorithm and hardware" (PDF). International Journal of Computer Vision. 12: 17–42. doi:10.1007/BF01420983. S2CID 6140819.
- ^ Brewer, Cynthia A. (1999). "Color Use Guidelines for Data Representation". Proceedings of the Section on Statistical Graphics. Alexandria, VA: American Statistical Association. pp. 55–60.
- ^ Fisher, Nicholas (1996). Statistical Analysis of Circular Data. Cambridge, England: Cambridge University Press.
- ^ Hanbury, Allan (2003). Circular Statistics Applied to Colour Images. 8th Computer Vision Winter Workshop. CiteSeerX 10.1.1.4.1381.
- ^ Poynton (1997). "What are HSB and HLS?"
Bibliography
- Agoston, Max K. (2005). Computer Graphics and Geometric Modeling: Implementation and Algorithms. London: Springer. pp. 300–306. ISBN 978-1-85233-818-3. Agoston's book contains a description of HSV and HSL, and algorithms in pseudocode for converting to each from RGB, and back again.
- Cheng, Heng-Da; Jiang, Xihua; Sun, Angela; Wang, Jingli (2001). "Color image segmentation: Advances and prospects". Pattern Recognition. 34 (12): 2259. CiteSeerX 10.1.1.119.2886. doi:10.1016/S0031-3203(00)00149-7. This computer vision literature review briefly summarizes research in color image segmentation, including that using HSV and HSI representations.
- Fairchild, Mark D. (2005). Color Appearance Models (2nd ed.). Addison-Wesley. This book doesn't discuss HSL or HSV specifically, but is one of the most readable and precise resources about current color science.
- Foley, J. D.; et al. (1995). Computer Graphics: Principles and Practice (2nd ed.). Redwood City, CA: Addison-Wesley. ISBN 978-0-201-84840-3. The standard computer graphics textbook of the 1990s, this tome has a chapter full of algorithms for converting between color models, in C.
- Hanbury, Allan; Serra, Jean (December 2002). A 3D-polar Coordinate Colour Representation Suitable for Image Analysis. Pattern Recognition and Image Processing Group Technical Report 77. Vienna, Austria: Vienna University of Technology.
- Hanbury, Allan (2008). "Constructing cylindrical coordinate colour spaces" (PDF). Pattern Recognition Letters. 29 (4): 494–500. CiteSeerX 10.1.1.211.6425. doi:10.1016/j.patrec.2007.11.002.
- Joblove, George H.; Greenberg, Donald (August 1978). "Color spaces for computer graphics" (PDF). Computer Graphics. 12 (3): 20–25. doi:10.1145/965139.807362. Joblove and Greenberg's paper was the first describing the HSL model, which it compares to HSV.
- Kuehni, Rolf G. (2003). Color Space and Its Divisions: Color Order from Antiquity to the present. New York: Wiley. ISBN 978-0-471-32670-0. This book only briefly mentions HSL and HSV, but is a comprehensive description of color order systems through history.
- Levkowitz, Haim; Herman, Gabor T. (1993). "GLHS: A Generalized Lightness, Hue and Saturation Color Model". CVGIP: Graphical Models and Image Processing. 55 (4): 271–285. doi:10.1006/cgip.1993.1019. This paper explains how both HSL and HSV, as well as other similar models, can be thought of as specific variants of a more general "GLHS" model. Levkowitz and Herman provide pseudocode for converting from RGB to GLHS and back.
- MacEvoy, Bruce (January 2010). "Color Vision". handprint.com.. Especially the sections about "Modern Color Models" and "Modern Color Theory". MacEvoy's extensive site about color science and paint mixing is one of the best resources on the web. On this page, he explains the color-making attributes, and the general goals and history of color order systems—including HSL and HSV—and their practical relevance to painters.
- Poynton, Charles (1997). "Frequently Asked Questions About Color". poynton.com. This self-published frequently asked questions page, by digital video expert Charles Poynton, explains, among other things, why in his opinion these models "are useless for the specification of accurate color", and should be abandoned in favor of more psychometrically relevant models.
- Poynton, Charles (2008). "YUV and luminance considered harmful". poynton.com. Retrieved August 30, 2017.
- Smith, Alvy Ray (August 1978). "Color gamut transform pairs". Computer Graphics. 12 (3): 12–19. doi:10.1145/965139.807361. This is the original paper describing the "hexcone" model, HSV. Smith was a researcher at NYIT's Computer Graphics Lab. He describes HSV's use in an early digital painting program.
External links
- Demonstrative color conversion applet
- HSV Colors by Hector Zenil, The Wolfram Demonstrations Project.
- HSV to RGB by CodeBeautify.

















 같은 결과가 됩니다.

![{\displaystyle H\in [0^{\circ },360^{\circ }]}](https://wikimedia.org/api/rest_v1/media/math/render/svg/9cf17f990e5505cd5aca4676434f793aebc81fd3)
![{\displaystyle S=S_{L}\in [0,1]}](https://wikimedia.org/api/rest_v1/media/math/render/svg/732396faa67fae03716d9f55265fa6b6ef77ecb8)


![[0,1]^{3}](https://wikimedia.org/api/rest_v1/media/math/render/svg/6acf30b2833a5dfcfedce1e2ae9bd8e6f68eb885)

 모듈의 소수 부분이


 R,G,B 함수는




![{\displaystyle S=S_{V}\in [0,1]}](https://wikimedia.org/api/rest_v1/media/math/render/svg/65ea08aa03a8e276bb8b64658a2693d8d8f339c0)


![{\displaystyle H_{V}\in [0^{\circ },360^{\circ }]}](https://wikimedia.org/api/rest_v1/media/math/render/svg/8a6f959f83cca177e18a7cef31d87ec28d1b17e3)
![{\displaystyle S_{V}\in [0,1]}](https://wikimedia.org/api/rest_v1/media/math/render/svg/56fb4fd539b3e55e9ffba906e3f6232fc01eaf9c)
![V\in [0,1]](https://wikimedia.org/api/rest_v1/media/math/render/svg/6c3f7b41a454e2fe2a6c9b33fbb6b5ba54b94c6b)


![{\displaystyle H_{L}\in [0^{\circ },360^{\circ }]}](https://wikimedia.org/api/rest_v1/media/math/render/svg/5e728f074765331ff6da39757c0d9bd8bb608079)
![{\displaystyle S_{L}\in [0,1]}](https://wikimedia.org/api/rest_v1/media/math/render/svg/15f571ef115b29613a66f80d27302833c60805be)
![{\displaystyle L\in [0,1]}](https://wikimedia.org/api/rest_v1/media/math/render/svg/94ca2d1c06c3302b08d75f674d5f3bf2b3b324cb)


![{\displaystyle R,G,B\in [0,1]}](https://wikimedia.org/api/rest_v1/media/math/render/svg/4df509b9bef4211262b8e7f03a4a22614d53245b)


