Ichimoku Kinkō Hyō

Ichimoku Kinko Hyo (IKH) (Japanese一目均衡表, Ichimoku Kinkō Hyō), usually shortened to "Ichimoku", is a technical analysis method that builds on candlestick charting to improve the accuracy of forecast price moves.
History
It was developed in the late 1930s by Goichi Hosoda (細田悟一, Hosoda Goichi), a Japanese journalist who used to be known as Ichimoku Sanjin (一目山人, Ichimoku Sanjin), which can be translated as "what a man in the mountain sees".[citation needed] He spent 30 years perfecting the technique before releasing his findings to the general public in the late 1960s.[1]
Ichimoku Kinko Hyo translates to one glance equilibrium chart or instant look at the balance chart and is sometimes referred to as "one glance cloud chart" based on the unique "clouds" that feature in Ichimoku charting.[2][3]
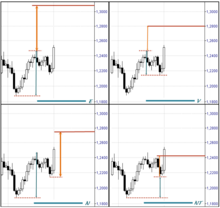
Ichimoku is a moving average-based trend identification system and because it contains more data points than standard candlestick charts, it provides a clearer picture of potential price action.[4] The main difference between how moving averages are plotted in Ichimoku as opposed to other methods is that Ichimoku's lines are constructed using the 50% point of the highs and lows as opposed to the candle's closing price. Ichimoku takes into consideration the factor of time as an additional element along with the price action, similar to William Delbert Gann's trading ideas.
In the Western world, it is solely known for its “Graphic Environment”, due to the fact that authors have not translated the original manual into English, German, nor Spanish. However, Ichimoku is also integrated by three other theories that improve and enhance the indicator:
- 시간 이론
- 웨이브 무브먼트 이론
- 목표 가격 이론
이치모쿠의 그래픽 환경의 핵심 요소
텐칸센
텐칸센(天kan線) 계산: (높은 값 + 낮은 값)/2 최근 9개 기간.
주로 신호 라인과 보조 지지/저항 라인으로 사용된다. 텐칸센(빨간색 선): 이것은 또한 터닝라인이라고도 하며, 지난 9개 기간 동안 가장 높고 가장 낮은 것을 평균하여 도출된다. 텐칸센은 시장 흐름을 보여주는 지표다. 레드라인이 위아래로 움직인다면 시장이 트렌드임을 보여주는 것이다. 수평으로 움직이면 시장 범위가 넓어짐을 알리는 신호다.
기준센
기준센(基基) 계산: (높음 + 낮음)/2 지난 26기간 동안
이것은 확인 라인, 지지/저항 라인으로, 후행 정지 라인으로 사용할 수 있다. 기준센은 향후 가격 이동의 지표 역할을 한다. 가격이 파란색 라인보다 높으면 계속 더 오를 수 있다. 가격이 블루라인보다 낮으면 계속 떨어질 수 있다.
센고우 스판 A
센고우(센고우) 스판 A 계산: (텐칸센 + 기준센)/2 플롯 26 기간.
선행 스팬 1이라고도 불리는 이 선은 쿠모나 구름의 한쪽 가장자리를 형성한다.
가격이 센고우 스팬 이상일 경우 상단 라인은 1차 지원 레벨로, 하단 라인은 2차 지원 레벨로 기능한다.
가격이 센고우 스판 이하일 경우, 맨 위 라인은 두 번째 저항 레벨인 반면 맨 아래 라인은 첫 번째 저항 레벨을 형성한다.
센고우 스판 B
센고우 스판 B 계산: (최고 상한 + 최저 하한)/2는 지난 52시간 동안 계산되어 26개 기간을 미리 표시하였다.
선행 스판 2라고도 불리는 이 선은 쿠모의 다른 가장자리를 형성한다.
쿠모
구모(九o, 구름)는 센고우 스판 A와 B 사이의 공간이다. 클라우드 가장자리는 현재 및 잠재적 미래 지원 지점과 저항 지점을 식별한다.
쿠모 구름은 가격 변동에 따라 모양과 높이가 달라진다. 이 높이는 큰 가격 변동이 두터운 구름을 형성하고, 이는 더 강한 지지와 저항을 낳기 때문에 변동성을 나타낸다. 얇은 구름은 약한 지지와 저항만을 제공하기 때문에, 물가는 그러한 얇은 구름들을 뚫고 나갈 수 있고 또 뚫는 경향이 있다.
일반적으로 센고우 스판 A가 센고우 스판 B보다 높을 때는 시장이 강세를 보이고, 시장이 약세를 보일 때는 반대로 시장이 강세를 보인다. 트레이더들은 센고우 스판A와 B가 포지션을 교환하는 미래 구름에서 쿠모 트위스트를 찾는 경우가 많은데, 이는 잠재적인 추세 역전의 신호탄이다.
두께 외에도 구름의 강도는 각도로 확인할 수 있다; 강세는 위쪽으로, 약성은 아래쪽으로 확인할 수 있다. 가격 이면에 있는 어떤 구름도 쿠모 쉐도우로 알려져 있다.
치커우 스판
치커우 스판 계산: 오늘의 종가는 차트에 26일 뒤로 예상되었다.
지지/저항 보조 도구로 사용되는 후행 스팬이라고도 한다.
지커우 스판이나 그린 라인이 상향 방향으로 가격을 넘으면 그것은 매수 신호다. 그린라인이 하향식 가격과 교차한다면 그것은 매도 신호다.
참조
- ^ "Main Page - IchiWiki - The Definitive Reference to the Ichimoku Kinko Hyo Charting System". www.kumotrader.com. Retrieved 2018-12-14.
- ^ "The History of Ichimoku 1968 - Present Day". ichi-mo-ku.com. Archived from the original on 22 June 2012. Retrieved 13 May 2013.
- ^ "Ichimoku Chikou Cross — MetaTrader Expert Advisor (MT4/MT5)". www.earnforex.com. Retrieved 2018-12-14.
- ^ Lioudis, Nick K. "Introducing Ichimoku Charts in Forex Trading". Investopedia. Retrieved 2018-12-14.
- ^ 페이지의 "이치모쿠 시간론" 섹션
- ^ 페이지 「이치모쿠 파동론」란 단면
- ^ 페이지 「이치모쿠 가격론」의 단면.
추가 읽기
- 이치모쿠 클라우드와의 거래: 뉴저지 호보켄의 이치모쿠 킨코 효 기술 분석의 필수 가이드: 와일리 트레이딩. ISBN 9780470609934
- 이치모쿠 차트: 영국 햄프셔의 이치모쿠 킨코 구름 소개: 하리만 하우스. ISBN 9781897597842


