미국의 도시화
Urbanization in the United States),_OWID.svg)
미국의 도시화는 역사 전반에 걸쳐 진행되어 왔다.지난 2세기 동안 미국은 농촌이 우세한 농업국가에서 도시화된 [2]산업국가로 변모했다.이것은 18세기 후반과 19세기 초반의 미국(그리고 서유럽의 일부)의 산업 혁명과 그 결과 미국이 경험했던 급속한 산업화 덕분이다.1790년에는 미국인 20명 중 1명만이 도시 지역에 살았지만, 이 비율은 1870년에는 4명 중 1명, 1920년에는 2명 중 1명, 1960년대에는 3명 중 2명, 2000년대에는 [2]5명 중 4명으로 극적으로 바뀌었다.
도시화.
미국의 도시화는 1910년에서 [2]1920년 사이에야 비로소 도시 주체가 되었다.현재 미국 인구의 5분의 4 이상이 도시 지역에 거주하고 있으며,[2] 이 비율은 오늘날에도 여전히 증가하고 있다.미국 인구조사국은 1950년과 1990년에 도시 지역의 분류와 정의를 변경했으며, 따라서 다른 기간의 [2][3]도시 데이터를 비교할 때 주의를 기울일 것을 권고한다.
도시화는 미국 북동부에서 가장 빨랐고,[2] 1880년까지 도시 다수를 차지했다.메사추세츠와 로드 아일랜드([4][5]1850년까지 주요 도시), 뉴욕(1870년 이후 주요 도시)를 포함한 미국 북동부의 일부 주들은 이미 그 전에 도시 다수를 차지했다.미국 중서부와 서부는 1910년대에 도시 다수를 차지했고, 미국 남부는 1950년대에 [2]제2차 세계대전 이후에야 도시 다수를 차지하게 되었다.
미국 서부는 오늘날 미국에서 가장 도시화된 지역이고, 미국 북동부가 그 뒤를 바짝 따르고 있다.미국 남부 지역은 제2차 세계대전 이후 급속한 산업화를 겪었고, 현재는 4분의 3 이상이 도시화되어 2010년에는 미국 [2]중서부와 거의 같은 도시 비율을 가지고 있다.오늘날 미국의 4개 주(50개 주 중)만이 농촌에서 과반수를 차지하고 있으며, 이들 주 중 일부 주(예: 미시시피)도 도시화를 계속하고 있습니다.미국의 일부 주에서는 현재 도시화율이 약 90%를 넘고 있으며, 이는 한 세기 전에 거의 전례가 없었던 일이다.
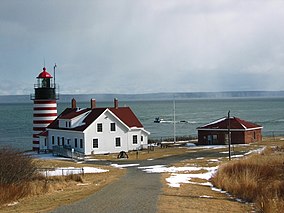
메인 주(및 버몬트 주)는 미국 내 나머지 지역에서 나타나고 있는 더 큰 도시화 추세에 역행했다.메인주의 가장 높은 도시 비율은 1950년 52% 미만이었으며, 오늘날 메인주 인구의 39% 미만이 도시 지역에 거주하고 있습니다.메인주는 현재 미국에서 가장 덜 도시화된 주이며, 도시 비율(39%)은 미국 평균(81%)[2]의 절반에도 미치지 못합니다.메인 주는 1790년 [2]첫 인구 조사 이후 모든 미국 인구 조사에서 미국 평균보다 덜 도시적이었다.

1942년 텍사스주 댈러스.


이력 통계
이 표/섹션의 데이터는 모두 미국 인구조사국의 데이터입니다.도시 인구의 정의는[definition needed] 시간이 [6]지남에 따라 변화하고 있습니다.1900년, 1950년, 2000년에 실시된 센서스에 새로운 정의가 사용되었습니다.
| 미국 지역 및 주별 전체 인구 비율에 따른 도시 인구(1790-2010) | |||||||||||||||||||||||
|---|---|---|---|---|---|---|---|---|---|---|---|---|---|---|---|---|---|---|---|---|---|---|---|
| 주/준주 | 2010 | 2000 | 1990 | 1980 | 1970 | 1960 | 1950 | 1940 | 1930 | 1920 | 1910 | 1900 | 1890 | 1880 | 1870 | 1860 | 1850 | 1840 | 1830 | 1820 | 1810 | 1800 | 1790 |
| 80.7% | 79.0% | 78.0% | 73.7% | 73.6% | 69.9% | 64.0% | 56.5% | 56.1% | 51.2% | 45.6% | 39.6% | 35.1% | 28.2% | 25.7% | 19.8% | 15.4% | 10.8% | 8.8% | 7.2% | 7.3% | 6.1% | 5.1% | |
| 북동쪽[2] | 85.0% | 84.4% | 84.0% | 79.2% | 80.5% | 80.2% | 79.5% | 76.6% | 77.6% | 75.5% | 71.8% | 66.1% | 59.0% | 50.8% | 44.3% | 35.7% | 26.9% | 18.5% | 14.2% | 11.0% | 10.9% | 9.3% | 8.1% |
| 중서부[2] | 75.9% | 74.7% | 73.9% | 70.5% | 71.6% | 68.7% | 64.1% | 58.4% | 57.9% | 52.3% | 45.1% | 38.6% | 33.1% | 24.2% | 20.8% | 13.9% | 9.2% | 3.9% | 2.6% | 1.1% | 0.9% | 0.0% | |
| 남쪽[2] | 75.8% | 72.8% | 71.5% | 66.9% | 64.8% | 58.5% | 48.6% | 36.7% | 34.1% | 28.1% | 25.5% | 18.3% | 16.3% | 12.2% | 12.2% | 9.6% | 8.3% | 6.7% | 5.3% | 4.6% | 4.1% | 3.0% | 2.1% |
| 서쪽[2] | 89.8% | 88.6% | 87.6% | 83.9% | 83.0% | 77.7% | 69.5% | 58.5% | 58.4% | 51.8% | 47.9% | 39.9% | 37.0% | 30.2% | 25.8% | 16.0% | 6.4% | ||||||
| 59.0% | 55.4% | 56.8% | 60.0% | 58.6% | 54.8% | 43.8% | 30.2% | 28.1% | 21.7% | 17.3% | 11.9% | 10.1% | 5.4% | 6.3% | 5.1% | 4.6% | 2.1% | 1.0% | 0.0% | 0.0% | 0.0% | ||
| 66.0% | 65.6% | 61.0% | 64.3% | 56.9% | 37.9% | 26.6% | 24.0% | 13.2% | 5.6% | 9.5% | 24.5% | 0.0% | 0.0% | ||||||||||
| 89.8% | 88.2% | 86.5% | 83.8% | 79.6% | 74.5% | 55.5% | 34.8% | 34.4% | 36.1% | 31.0% | 15.9% | 9.4% | 17.3% | 33.4% | 0.0% | ||||||||
| 56.2% | 52.5% | 52.0% | 51.6% | 50.0% | 42.8% | 33.0% | 22.2% | 20.6% | 16.6% | 12.9% | 8.5% | 6.5% | 4.6% | 2.6% | 0.9% | 0.0% | 0.0% | 0.0% | 0.0% | 0.0% | |||
| 95.0% | 94.4% | 93.7% | 91.3% | 90.9% | 86.4% | 80.7% | 71.0% | 73.3% | 67.9% | 61.8% | 52.3% | 48.6% | 42.9% | 37.2% | 20.7% | 7.4% | |||||||
| 86.2% | 84.5% | 83.8% | 80.6% | 78.5% | 73.7% | 62.7% | 52.6% | 50.2% | 48.2% | 50.3% | 48.3% | 45.0% | 31.4% | 11.9% | 13.9% | ||||||||
| 88.0% | 87.7% | 87.0% | 78.8% | 78.4% | 78.3% | 77.6% | 67.8% | 70.4% | 67.8% | 65.6% | 59.9% | 50.9% | 41.9% | 33.0% | 26.5% | 16.0% | 12.6% | 9.4% | 7.6% | 6.1% | 5.1% | 3.0% | |
| 83.3% | 80.1% | 79.2% | 70.6% | 72.2% | 65.6% | 62.6% | 52.3% | 51.7% | 54.2% | 48.0% | 46.4% | 42.2% | 33.4% | 24.7% | 18.9% | 15.3% | 10.7% | 0.0% | 0.0% | 0.0% | 0.0% | 1.3% | |
| 100.0% | 100.0% | 100.0% | 100.0% | 100.0% | 100.0% | 100.0% | 100.0% | 100.0% | 100.0% | 100.0% | 100.0% | 100.0% | 90.0% | 91.6% | 93.0% | 93.6% | 90.9% | 90.1% | 88.3% | 85.0% | 76.2% | ||
| 91.2% | 89.3% | 88.0% | 84.3% | 81.7% | 73.9% | 65.5% | 55.1% | 51.7% | 36.5% | 29.1% | 20.3% | 19.8% | 10.0% | 8.1% | 4.1% | 0.0% | 0.0% | 0.0% | |||||
| 75.1% | 71.6% | 68.8% | 62.4% | 60.3% | 55.3% | 45.3% | 34.4% | 30.8% | 25.1% | 20.6% | 15.6% | 14.0% | 9.4% | 8.4% | 7.1% | 4.3% | 3.6% | 2.7% | 2.2% | 2.1% | 3.2% | 0.0% | |
| 91.9% | 91.5% | 90.5% | 86.5% | 83.1% | 76.5% | 69.0% | 62.5% | 53.7% | 36.1% | 30.7% | 25.5% | ||||||||||||
| 70.6% | 66.4% | 62.2% | 54.0% | 54.1% | 47.5% | 42.9% | 33.7% | 29.1% | 27.6% | 21.5% | 6.2% | 0.0% | 0.0% | 0.0% | |||||||||
| 88.5% | 87.8% | 86.4% | 83.3% | 83.2% | 80.7% | 77.6% | 73.6% | 73.9% | 67.9% | 61.7% | 54.3% | 44.9% | 30.6% | 23.5% | 14.3% | 7.6% | 2.0% | 0.0% | 0.0% | 0.0% | 0.0% | ||
| 72.4% | 70.8% | 69.1% | 64.2% | 64.9% | 62.4% | 59.9% | 55.1% | 55.5% | 50.6% | 42.4% | 34.3% | 26.9% | 19.5% | 14.7% | 8.6% | 4.5% | 1.6% | 0.0% | 0.0% | 0.0% | 0.0% | ||
| 64.0% | 61.1% | 59.4% | 58.6% | 57.2% | 53.0% | 47.7% | 42.7% | 39.6% | 36.4% | 30.6% | 25.6% | 21.2% | 15.2% | 13.1% | 8.9% | 5.1% | 0.0% | ||||||
| 74.2% | 71.4% | 69.5% | 66.7% | 66.1% | 61.0% | 52.1% | 41.9% | 38.8% | 34.8% | 29.1% | 22.4% | 18.9% | 10.5% | 14.2% | 9.4% | ||||||||
| 58.4% | 55.8% | 55.8% | 50.9% | 52.3% | 44.5% | 36.8% | 29.8% | 30.6% | 26.2% | 24.3% | 21.8% | 19.2% | 15.2% | 14.8% | 10.4% | 7.5% | 4.0% | 2.4% | 1.6% | 1.1% | 0.0% | 0.0% | |
| 73.2% | 72.6% | 72.9% | 68.6% | 66.5% | 63.3% | 54.8% | 41.5% | 39.7% | 34.9% | 30.0% | 26.5% | 25.4% | 25.5% | 27.9% | 26.1% | 26.0% | 29.9% | 21.4% | 17.7% | 22.5% | |||
| 38.7% | 40.2% | 42.6% | 47.5% | 50.8% | 51.3% | 51.7% | 40.5% | 40.3% | 39.0% | 35.3% | 33.5% | 28.1% | 22.6% | 21.0% | 16.6% | 13.5% | 7.8% | 3.2% | 2.9% | 3.1% | 2.4% | 0.0% | |
| 87.2% | 86.1% | 85.0% | 80.3% | 76.6% | 72.7% | 69.0% | 59.3% | 59.8% | 60.0% | 50.8% | 49.8% | 47.6% | 40.2% | 37.8% | 34.0% | 32.3% | 24.2% | 20.4% | 16.3% | 12.2% | 7.8% | 4.2% | |
| 92.0% | 91.4% | 90.5% | 83.8% | 84.6% | 83.6% | 84.4% | 89.4% | 90.2% | 90.0% | 89.0% | 86.0% | 82.0% | 74.7% | 66.7% | 59.6% | 50.7%[4] | 37.9% | 31.1% | 22.8% | 21.3% | 15.4% | 13.5% | |
| 74.6% | 74.7% | 75.2% | 70.7% | 74.0% | 73.4% | 70.7% | 65.7% | 68.2% | 61.1% | 47.2% | 39.3% | 34.9% | 24.8% | 20.1% | 13.3% | 7.3% | 4.3% | 0.0% | 0.0% | 0.0% | 0.0% | ||
| 73.3% | 70.9% | 69.0% | 66.9% | 66.5% | 62.2% | 54.5% | 49.8% | 49.0% | 44.1% | 41.0% | 34.1% | 33.8% | 19.1% | 16.1% | 9.4% | 0.0% | |||||||
| 49.3% | 48.8% | 49.0% | 47.3% | 44.5% | 37.7% | 27.9% | 19.8% | 16.9% | 13.4% | 11.5% | 7.7% | 5.4% | 3.1% | 4.0% | 2.6% | 1.8% | 1.0% | 2.0% | 0.0% | 0.0% | 0.0% | ||
| 70.4% | 69.4% | 69.6% | 68.1% | 70.1% | 66.6% | 61.5% | 51.8% | 51.2% | 46.6% | 42.3% | 36.3% | 32.0% | 25.2% | 25.0% | 17.2% | 11.8% | 4.3% | 3.5% | 0.0% | 0.0% | |||
| 55.9% | 54.1% | 56.4% | 52.9% | 53.4% | 50.2% | 43.7% | 37.8% | 33.7% | 31.3% | 35.5% | 34.7% | 27.1% | 17.8% | 15.1% | |||||||||
| 73.1% | 69.8% | 67.2% | 62.9% | 61.5% | 54.3% | 46.9% | 39.1% | 35.3% | 31.3% | 26.1% | 23.7% | 27.4% | 13.6% | 18.0% | 0.0% | ||||||||
| 94.2% | 91.5% | 87.4% | 85.3% | 80.9% | 70.4% | 57.2% | 39.3% | 37.8% | 19.7% | 16.3% | 17.0% | 33.8% | 31.1% | 16.4% | 0.0% | ||||||||
| 60.3% | 59.3% | 57.2% | 52.2% | 56.4% | 58.3% | 57.5% | 57.6% | 58.7% | 56.5% | 51.8% | 46.7% | 39.3% | 30.0% | 26.2% | 22.1% | 17.1% | 10.0% | 5.0% | 3.0% | 3.2% | 2.9% | 3.3% | |
| 94.7% | 94.4% | 93.5% | 89.0% | 88.9% | 88.6% | 86.6% | 81.6% | 82.6% | 79.9% | 76.4% | 70.6% | 62.6% | 54.4% | 43.7% | 32.7% | 17.6% | 10.6% | 5.7% | 2.7% | 2.4% | 0.0% | 0.0% | |
| 77.4% | 75.0% | 75.0% | 72.1% | 69.8% | 65.9% | 50.2% | 33.2% | 25.2% | 18.0% | 14.2% | 14.0% | 6.2% | 5.5% | 5.2% | 5.3% | 7.4% | |||||||
| 87.9% | 87.5% | 87.4% | 84.6% | 85.7% | 85.4% | 85.5% | 82.8% | 83.6% | 82.7% | 78.9% | 72.9% | 65.1% | 56.4% | 50.0% | 39.3% | 29.2% | 19.4% | 14.9% | 11.7% | 12.7% | 12.7% | 11.5% | |
| 66.1% | 60.2% | 57.8% | 48.0% | 45.5% | 39.5% | 33.7% | 27.3% | 25.5% | 19.2% | 14.4% | 9.9% | 7.2% | 3.9% | 3.4% | 2.5% | 2.4% | 1.8% | 1.4% | 2.0% | 0.0% | 0.0% | 0.0% | |
| 59.9% | 55.9% | 53.4% | 48.8% | 44.3% | 35.2% | 26.6% | 20.6% | 16.6% | 13.6% | 11.0% | 7.3% | 5.6% | 7.3% | 0.0% | |||||||||
| 77.9% | 77.4% | 77.5% | 73.3% | 75.3% | 73.4% | 70.2% | 66.8% | 67.8% | 63.8% | 55.9% | 48.1% | 41.1% | 32.2% | 25.6% | 17.1% | 12.2% | 5.5% | 3.9% | 1.7% | 1.1% | 0.0% | ||
| 66.2% | 65.3% | 65.2% | 67.3% | 68.0% | 62.9% | 51.0% | 37.6% | 34.3% | 26.5% | 19.2% | 7.4% | 3.7% | |||||||||||
| 81.0% | 78.7% | 74.9% | 67.9% | 67.1% | 62.2% | 53.9% | 48.8% | 51.3% | 49.8% | 45.6% | 32.2% | 27.9% | 14.8% | 9.1% | 5.5% | 0.0% | |||||||
| 78.7% | 77.1% | 76.8% | 69.3% | 71.5% | 71.6% | 70.5% | 66.5% | 67.8% | 65.1% | 60.4% | 54.7% | 48.6% | 41.6% | 37.3% | 30.8% | 23.6% | 17.9% | 15.3% | 13.0% | 12.8% | 11.3% | 10.2% | |
| 90.7% | 90.9% | 89.9% | 87.0% | 87.1% | 86.4% | 84.3% | 91.6% | 92.4% | 91.9% | 91.0% | 88.3% | 85.3% | 82.0% | 74.6% | 63.3% | 55.6%[5] | 43.8% | 31.2% | 23.0% | 23.4% | 20.8% | 19.0% | |
| 66.3% | 60.5% | 61.5% | 54.1% | 48.3% | 41.2% | 36.7% | 24.5% | 21.3% | 17.5% | 14.8% | 12.8% | 10.1% | 7.5% | 8.6% | 6.9% | 7.3% | 5.7% | 5.8% | 4.9% | 6.0% | 5.4% | 6.6% | |
| 56.7% | 51.9% | 50.3% | 46.4% | 44.6% | 39.3% | 33.2% | 24.6% | 18.9% | 16.0% | 13.1% | 10.2% | 8.2% | 7.3% | 0.0% | |||||||||
| 66.4% | 63.6% | 62.7% | 60.4% | 59.1% | 52.3% | 44.1% | 35.2% | 34.3% | 26.1% | 20.2% | 16.2% | 13.5% | 7.5% | 7.5% | 4.2% | 2.2% | 0.8% | 0.8% | 0.0% | 0.0% | 0.0% | 0.0% | |
| 84.7% | 82.5% | 81.2% | 79.6% | 79.7% | 75.0% | 62.7% | 45.4% | 41.0% | 32.4% | 24.1% | 17.1% | 15.6% | 9.2% | 6.7% | 4.4% | 3.6% | |||||||
| 90.6% | 88.2% | 86.8% | 84.4% | 80.4% | 74.9% | 65.3% | 55.5% | 52.4% | 48.0% | 46.3% | 38.1% | 35.7% | 23.4% | 18.5% | 20.5% | 0.0% | |||||||
| 38.9% | 38.2% | 40.2% | 33.8% | 32.2% | 38.5% | 36.4% | 34.3% | 33.0% | 31.2% | 27.8% | 22.1% | 15.2% | 10.0% | 6.9% | 2.0% | 1.9% | 0.0% | 0.0% | 0.0% | 0.0% | 0.0% | 0.0% | |
| 75.5% | 73.0% | 71.5% | 66.0% | 63.2% | 55.6% | 47.0% | 35.3% | 32.4% | 29.2% | 23.1% | 18.3% | 17.1% | 12.5% | 11.9% | 9.5% | 8.0% | 6.9% | 4.8% | 3.8% | 3.6% | 2.6% | 1.8% | |
| 84.0% | 82.0% | 79.9% | 73.5% | 73.4% | 68.1% | 63.2% | 53.1% | 56.6% | 54.8% | 53.0% | 40.8% | 35.6% | 9.5% | 0.0% | 0.0% | 0.0% | |||||||
| 48.7% | 46.1% | 46.9% | 36.2% | 39.1% | 38.2% | 34.6% | 28.1% | 28.4% | 25.2% | 18.7% | 13.1% | 10.7% | 8.7% | 8.1% | 5.3% | 3.8% | 3.5% | 0.0% | 0.0% | 0.0% | 0.0% | 0.0% | |
| 70.2% | 68.3% | 67.3% | 64.2% | 65.9% | 63.8% | 57.9% | 53.5% | 52.9% | 47.3% | 43.0% | 38.2% | 33.2% | 24.1% | 19.6% | 14.4% | 9.4% | 0.0% | 0.0% | 0.0% | ||||
| 64.8% | 65.1% | 67.1% | 62.7% | 60.5% | 56.8% | 49.8% | 37.3% | 31.1% | 29.4% | 29.6% | 28.8% | 34.3% | 29.6% | 0.0% | |||||||||
| 93.8% | 94.4% | 92.9% | 66.8% | 58.1% | 44.2% | 40.5% | 30.3% | 27.7% | 21.8% | 20.1% | 14.6%[a] | ||||||||||||
a^ 이 데이텀은 1900년이 아닌 1899년부터입니다.
「 」를 참조해 주세요.
레퍼런스
- ^ "Urban and rural populations in the United States". Our World in Data. Retrieved 6 March 2020.
- ^ a b c d e f g h i j k l m n o United States Summary: 2010 (PDF). 2010 Census of Population and Housing, Population and Housing Unit Counts, CPH-2-5. U.S. Government Printing Office, Washington, DC: U.S. Census Bureau. 2012. pp. 20–26. Retrieved March 1, 2013.
- ^ "Population Division Working Paper - Historical Census Statistics on Population Totals By Race, 1790 to 1990, and By Hispanic Origin, 1970 to 1990 - U.S. Census Bureau". Census.gov. Archived from the original on 2012-08-12. Retrieved 2013-03-18.
- ^ a b c Massachusetts: 2010 (PDF). 2010 Census of Population and Housing, Population and Housing Unit Counts, CPH-2-5. U.S. Government Printing Office, Washington, DC: U.S. Census Bureau. 2012. p. 1. Retrieved March 1, 2013.
- ^ a b c Rhode Island: 2010 (PDF). 2010 Census of Population and Housing, Population and Housing Unit Counts, CPH-2-5. U.S. Government Printing Office, Washington, DC: U.S. Census Bureau. 2012. p. 1. Retrieved March 1, 2013.
- ^ US Census Bureau, Census History Staff. "Urban and Rural Areas - History - U.S. Census Bureau". www.census.gov. Retrieved 2019-01-08.
- ^ Alabama: 2010 (PDF). 2010 Census of Population and Housing, Population and Housing Unit Counts, CPH-2-5. U.S. Government Printing Office, Washington, DC: U.S. Census Bureau. 2012. p. 1. Retrieved March 1, 2013.
- ^ Alaska: 2010 (PDF). 2010 Census of Population and Housing, Population and Housing Unit Counts, CPH-2-5. U.S. Government Printing Office, Washington, DC: U.S. Census Bureau. 2012. p. 1. Retrieved March 1, 2013.
- ^ Arizona: 2010 (PDF). 2010 Census of Population and Housing, Population and Housing Unit Counts, CPH-2-5. U.S. Government Printing Office, Washington, DC: U.S. Census Bureau. 2012. p. 1. Retrieved March 1, 2013.
- ^ Arkansas: 2010 (PDF). 2010 Census of Population and Housing, Population and Housing Unit Counts, CPH-2-5. U.S. Government Printing Office, Washington, DC: U.S. Census Bureau. 2012. p. 1. Retrieved March 1, 2013.
- ^ California: 2010 (PDF). 2010 Census of Population and Housing, Population and Housing Unit Counts, CPH-2-5. U.S. Government Printing Office, Washington, DC: U.S. Census Bureau. 2012. p. 1. Retrieved March 1, 2013.
- ^ Colorado: 2010 (PDF). 2010 Census of Population and Housing, Population and Housing Unit Counts, CPH-2-5. U.S. Government Printing Office, Washington, DC: U.S. Census Bureau. 2012. p. 1. Retrieved March 1, 2013.
- ^ Connecticut: 2010 (PDF). 2010 Census of Population and Housing, Population and Housing Unit Counts, CPH-2-5. U.S. Government Printing Office, Washington, DC: U.S. Census Bureau. 2012. p. 1. Retrieved March 1, 2013.
- ^ Delaware: 2010 (PDF). 2010 Census of Population and Housing, Population and Housing Unit Counts, CPH-2-5. U.S. Government Printing Office, Washington, DC: U.S. Census Bureau. 2012. p. 1. Retrieved March 1, 2013.
- ^ District of Columbia: 2010 (PDF). 2010 Census of Population and Housing, Population and Housing Unit Counts, CPH-2-5. U.S. Government Printing Office, Washington, DC: U.S. Census Bureau. 2012. p. 1. Retrieved March 1, 2013.
- ^ Florida: 2010 (PDF). 2010 Census of Population and Housing, Population and Housing Unit Counts, CPH-2-5. U.S. Government Printing Office, Washington, DC: U.S. Census Bureau. 2012. p. 1. Retrieved March 1, 2013.
- ^ Georgia: 2010 (PDF). 2010 Census of Population and Housing, Population and Housing Unit Counts, CPH-2-5. U.S. Government Printing Office, Washington, DC: U.S. Census Bureau. 2012. p. 1. Retrieved March 1, 2013.
- ^ Hawaii: 2010 (PDF). 2010 Census of Population and Housing, Population and Housing Unit Counts, CPH-2-5. U.S. Government Printing Office, Washington, DC: U.S. Census Bureau. 2012. p. 1. Retrieved March 1, 2013.
- ^ Idaho: 2010 (PDF). 2010 Census of Population and Housing, Population and Housing Unit Counts, CPH-2-5. U.S. Government Printing Office, Washington, DC: U.S. Census Bureau. 2012. p. 1. Retrieved March 1, 2013.
- ^ Illinois: 2010 (PDF). 2010 Census of Population and Housing, Population and Housing Unit Counts, CPH-2-5. U.S. Government Printing Office, Washington, DC: U.S. Census Bureau. 2012. p. 1. Retrieved March 1, 2013.
- ^ Indiana: 2010 (PDF). 2010 Census of Population and Housing, Population and Housing Unit Counts, CPH-2-5. U.S. Government Printing Office, Washington, DC: U.S. Census Bureau. 2012. p. 1. Retrieved March 1, 2013.
- ^ Iowa: 2010 (PDF). 2010 Census of Population and Housing, Population and Housing Unit Counts, CPH-2-5. U.S. Government Printing Office, Washington, DC: U.S. Census Bureau. 2012. p. 1. Retrieved March 1, 2013.
- ^ Kansas: 2010 (PDF). 2010 Census of Population and Housing, Population and Housing Unit Counts, CPH-2-5. U.S. Government Printing Office, Washington, DC: U.S. Census Bureau. 2012. p. 1. Retrieved March 1, 2013.
- ^ Kentucky: 2010 (PDF). 2010 Census of Population and Housing, Population and Housing Unit Counts, CPH-2-5. U.S. Government Printing Office, Washington, DC: U.S. Census Bureau. 2012. p. 1. Retrieved March 1, 2013.
- ^ Louisiana: 2010 (PDF). 2010 Census of Population and Housing, Population and Housing Unit Counts, CPH-2-5. U.S. Government Printing Office, Washington, DC: U.S. Census Bureau. 2012. p. 1. Retrieved March 1, 2013.
- ^ Maine: 2010 (PDF). 2010 Census of Population and Housing, Population and Housing Unit Counts, CPH-2-5. U.S. Government Printing Office, Washington, DC: U.S. Census Bureau. 2012. p. 1. Retrieved March 1, 2013.
- ^ Maryland: 2010 (PDF). 2010 Census of Population and Housing, Population and Housing Unit Counts, CPH-2-5. U.S. Government Printing Office, Washington, DC: U.S. Census Bureau. 2012. p. 1. Retrieved March 1, 2013.
- ^ Michigan: 2010 (PDF). 2010 Census of Population and Housing, Population and Housing Unit Counts, CPH-2-5. U.S. Government Printing Office, Washington, DC: U.S. Census Bureau. 2012. p. 1. Retrieved March 1, 2013.
- ^ Minnesota: 2010 (PDF). 2010 Census of Population and Housing, Population and Housing Unit Counts, CPH-2-5. U.S. Government Printing Office, Washington, DC: U.S. Census Bureau. 2012. p. 1. Retrieved March 1, 2013.
- ^ Mississippi: 2010 (PDF). 2010 Census of Population and Housing, Population and Housing Unit Counts, CPH-2-5. U.S. Government Printing Office, Washington, DC: U.S. Census Bureau. 2012. p. 1. Retrieved March 1, 2013.
- ^ Missouri: 2010 (PDF). 2010 Census of Population and Housing, Population and Housing Unit Counts, CPH-2-5. U.S. Government Printing Office, Washington, DC: U.S. Census Bureau. 2012. p. 1. Retrieved March 1, 2013.
- ^ Montana: 2010 (PDF). 2010 Census of Population and Housing, Population and Housing Unit Counts, CPH-2-5. U.S. Government Printing Office, Washington, DC: U.S. Census Bureau. 2012. p. 1. Retrieved March 1, 2013.
- ^ Nebraska: 2010 (PDF). 2010 Census of Population and Housing, Population and Housing Unit Counts, CPH-2-5. U.S. Government Printing Office, Washington, DC: U.S. Census Bureau. 2012. p. 1. Retrieved March 1, 2013.
- ^ Nevada: 2010 (PDF). 2010 Census of Population and Housing, Population and Housing Unit Counts, CPH-2-5. U.S. Government Printing Office, Washington, DC: U.S. Census Bureau. 2012. p. 1. Retrieved March 1, 2013.
- ^ New Hampshire: 2010 (PDF). 2010 Census of Population and Housing, Population and Housing Unit Counts, CPH-2-5. U.S. Government Printing Office, Washington, DC: U.S. Census Bureau. 2012. p. 1. Retrieved March 1, 2013.
- ^ New Jersey: 2010 (PDF). 2010 Census of Population and Housing, Population and Housing Unit Counts, CPH-2-5. U.S. Government Printing Office, Washington, DC: U.S. Census Bureau. 2012. p. 1. Retrieved March 1, 2013.
- ^ New Mexico: 2010 (PDF). 2010 Census of Population and Housing, Population and Housing Unit Counts, CPH-2-5. U.S. Government Printing Office, Washington, DC: U.S. Census Bureau. 2012. p. 1. Retrieved March 1, 2013.
- ^ New York: 2010 (PDF). 2010 Census of Population and Housing, Population and Housing Unit Counts, CPH-2-5. U.S. Government Printing Office, Washington, DC: U.S. Census Bureau. 2012. p. 1. Retrieved March 1, 2013.
- ^ North Carolina: 2010 (PDF). 2010 Census of Population and Housing, Population and Housing Unit Counts, CPH-2-5. U.S. Government Printing Office, Washington, DC: U.S. Census Bureau. 2012. p. 1. Retrieved March 1, 2013.
- ^ North Dakota: 2010 (PDF). 2010 Census of Population and Housing, Population and Housing Unit Counts, CPH-2-5. U.S. Government Printing Office, Washington, DC: U.S. Census Bureau. 2012. p. 1. Retrieved March 1, 2013.
- ^ Ohio: 2010 (PDF). 2010 Census of Population and Housing, Population and Housing Unit Counts, CPH-2-5. U.S. Government Printing Office, Washington, DC: U.S. Census Bureau. 2012. p. 1. Retrieved March 1, 2013.
- ^ Oklahoma: 2010 (PDF). 2010 Census of Population and Housing, Population and Housing Unit Counts, CPH-2-5. U.S. Government Printing Office, Washington, DC: U.S. Census Bureau. 2012. p. 1. Retrieved March 1, 2013.
- ^ Oregon: 2010 (PDF). 2010 Census of Population and Housing, Population and Housing Unit Counts, CPH-2-5. U.S. Government Printing Office, Washington, DC: U.S. Census Bureau. 2012. p. 1. Retrieved March 1, 2013.
- ^ Pennsylvania: 2010 (PDF). 2010 Census of Population and Housing, Population and Housing Unit Counts, CPH-2-5. U.S. Government Printing Office, Washington, DC: U.S. Census Bureau. 2012. p. 1. Retrieved March 1, 2013.
- ^ South Carolina: 2010 (PDF). 2010 Census of Population and Housing, Population and Housing Unit Counts, CPH-2-5. U.S. Government Printing Office, Washington, DC: U.S. Census Bureau. 2012. p. 1. Retrieved March 1, 2013.
- ^ South Dakota: 2010 (PDF). 2010 Census of Population and Housing, Population and Housing Unit Counts, CPH-2-5. U.S. Government Printing Office, Washington, DC: U.S. Census Bureau. 2012. p. 1. Retrieved March 1, 2013.
- ^ Tennessee: 2010 (PDF). 2010 Census of Population and Housing, Population and Housing Unit Counts, CPH-2-5. U.S. Government Printing Office, Washington, DC: U.S. Census Bureau. 2012. p. 1. Retrieved March 1, 2013.
- ^ Texas: 2010 (PDF). 2010 Census of Population and Housing, Population and Housing Unit Counts, CPH-2-5. U.S. Government Printing Office, Washington, DC: U.S. Census Bureau. 2012. p. 1. Retrieved March 1, 2013.
- ^ Utah: 2010 (PDF). 2010 Census of Population and Housing, Population and Housing Unit Counts, CPH-2-5. U.S. Government Printing Office, Washington, DC: U.S. Census Bureau. 2012. p. 1. Retrieved March 1, 2013.
- ^ Vermont: 2010 (PDF). 2010 Census of Population and Housing, Population and Housing Unit Counts, CPH-2-5. U.S. Government Printing Office, Washington, DC: U.S. Census Bureau. 2012. p. 1. Retrieved March 1, 2013.
- ^ Virginia: 2010 (PDF). 2010 Census of Population and Housing, Population and Housing Unit Counts, CPH-2-5. U.S. Government Printing Office, Washington, DC: U.S. Census Bureau. 2012. p. 1. Retrieved March 1, 2013.
- ^ Washington: 2010 (PDF). 2010 Census of Population and Housing, Population and Housing Unit Counts, CPH-2-5. U.S. Government Printing Office, Washington, DC: U.S. Census Bureau. 2012. p. 1. Retrieved March 1, 2013.
- ^ West Virginia: 2010 (PDF). 2010 Census of Population and Housing, Population and Housing Unit Counts, CPH-2-5. U.S. Government Printing Office, Washington, DC: U.S. Census Bureau. 2012. p. 1. Retrieved March 1, 2013.
- ^ Wisconsin: 2010 (PDF). 2010 Census of Population and Housing, Population and Housing Unit Counts, CPH-2-5. U.S. Government Printing Office, Washington, DC: U.S. Census Bureau. 2012. p. 1. Retrieved March 1, 2013.
- ^ Wyoming: 2010 (PDF). 2010 Census of Population and Housing, Population and Housing Unit Counts, CPH-2-5. U.S. Government Printing Office, Washington, DC: U.S. Census Bureau. 2012. p. 1. Retrieved March 1, 2013.
- ^ Puerto Rico: 2010 (PDF). 2010 Census of Population and Housing, Population and Housing Unit Counts, CPH-2-5. U.S. Government Printing Office, Washington, DC: U.S. Census Bureau. 2012. p. 1. Retrieved March 1, 2013.