산토 토마스, 이사벨라
Santo Tomas, Isabela산토 토마스 | |
|---|---|
| 산토 토마스 | |
 | |
 깃발  봉인 | |
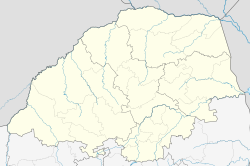
 산토 토마스가 강조 표시된 이사벨라 지도 | |
오픈스트리트맵  | |
.svg) 산토 토마스 필리핀 내 위치 | |
| 좌표:17°24°N 동경 121도46도E/17.4°N 121.77°E좌표: 17°24′N 121°46′E / 17.4°N 121.77°E/ °E | |
| 나라 | 필리핀 |
| 지역 | 카가얀 계곡 |
| 주 | 이자벨라 |
| 구 | 제1구 |
| 설립됨 | 1855 |
| 바랑게이 | 27 (바랑게이 참조) |
| 정부 | |
| • 유형 | 상무니앙바얀 |
| • 시장 | 안토니오 M.탈라우, 시니어 |
| • 부시장 | 레안드로 안토니오 P.탈라우에 |
| • 대표 | 안토니오 T.알바노 |
| • 유권자 | 유권자 16,274명(2019년) |
| 면적 | |
| • 합계 | 60.70km2(23.44 sq mi) |
| 표고 | 35m(제곱 피트) |
| 최고 고도 | 66m(217ft) |
| 최저 고도 | 16m(52ft) |
| 인구 (1998년 인구조사) | |
| • 합계 | 24,528 |
| • 밀도 | 400/km2(1,000/sq mi) |
| • 가구 | 4,903 |
| 이코노미 | |
| • 소득계층 | 제4기 시립 소득계층 |
| • 빈곤 발생 | 21.17% (2015)[5] |
| • 수익 | ₱127,334,767.49 (2020) |
| • 자산 | ₱99,183,698.65 (2020) |
| • 지출 | ₱108,176,109.48 (2020) |
| • 부채 | ₱107,498,840.92 (2020) |
| 서비스 제공업체 | |
| • 전기 | 이자벨라 2 전기 협동조합 (ISELCO 2) |
| 시간대 | UTC+8(PST) |
| 우편번호 | 3327 |
| PSGC | |
| IDD : 지역번호 | +63 (0)78 |
| 네이티브 언어 | 일로카노 타갈로그어 |
산토 토마스(Santo Tomas), 공식적으로는 산토 토마스(Ibanag:Ili nat Santo Tomas; Ilocano:Ili ti Santo Tomas; Tagalog:바얀 ng 산토 토마스)는 필리핀 이사벨라 지방의 4급 자치단체다.2020년 인구조사에 따르면 인구는 2만4528명이다.[4]
1952년 산토 토마스는 아부트와 미낙백의 바리오스가 새로 생긴 말리그 마을로 옮겨지면서 바리오 2개를 잃었다.[6]1961년, 그 바리오들은 새로 생긴 케존 시로 이전되었다.[7]
지리
산토 토마스는 이사벨라 주 북부에 위치한 육지로 둘러싸인 자치단체다.서쪽으로는 퀘존, 남쪽으로는 델핀 알바노, 남동쪽으로는 투마우니, 북쪽으로는 카바간, 카가얀 강에 의해 북동쪽으로 경계를 이루고 있다.
바랑게이
산토 토마스는 정치적으로 27개의 바랑게이로 세분되어 있다. [8]
- 암무가우안
- 안티건
- 바가바그
- 바구타리
- 발렝
- 바룸봉
- 비가오시덴탈
- 비가 오리엔탈
- 부벅
- 볼리나오쿨랄라보
- 칼라니건 노르트
- 칼라니건 수르
- 칼리나오안 센트로
- 칼리나오안 말라신
- 칼리나오안 노르트
- 카뇨간 아바조 노르트
- 카뇨간아바조수르
- 카뇨간알토
- 센트로
- 콜룬구안
- 말라파게이
- 산라파엘아바조
- 산라파엘알토
- 산로크
- 산비센테
- 우앙툴랴오
- 우아앙갈리시아
기후
| 이사벨라 산토 토마스의 기후 데이터 | |||||||||||||
|---|---|---|---|---|---|---|---|---|---|---|---|---|---|
| 월 | 얀 | 2월 | 3월 | 4월 | 5월 | 준 | 줄리 | 8월 | 9월 | 10월 | 11월 | 12월 | 연도 |
| 평균 높은 °C(°F) | 29 (84) | 30 (86) | 32 (90) | 35 (95) | 35 (95) | 35 (95) | 34 (93) | 33 (91) | 32 (90) | 31 (88) | 30 (86) | 28 (82) | 32 (90) |
| 평균 낮은 °C(°F) | 19 (66) | 20 (68) | 21 (70) | 23 (73) | 23 (73) | 24 (75) | 23 (73) | 23 (73) | 23 (73) | 22 (72) | 21 (70) | 20 (68) | 22 (71) |
| 평균 강수량 mm(인치) | 31.2 (1.23) | 23 (0.9) | 27.7 (1.09) | 28.1 (1.11) | 113.5 (4.47) | 141.4 (5.57) | 176.4 (6.94) | 236.6 (9.31) | 224.9 (8.85) | 247.7 (9.75) | 222.9 (8.78) | 178 (7.0) | 1,651.4 (65) |
| 평균 비 오는 날 | 10 | 6 | 5 | 5 | 13 | 12 | 15 | 15 | 15 | 17 | 16 | 15 | 144 |
| 출처: World Weather Online(모델링/계산된 데이터, 로컬에서 측정되지 않음)[9] | |||||||||||||
인구통계학
|
| ||||||||||||||||||||||||||||||||||||||||||
| 출처: 필리핀 통계청 | |||||||||||||||||||||||||||||||||||||||||||
2020년 인구조사에서 이사벨라 산토 토마스의 인구는 2만4528명으로, 밀도는 평방킬로미터당 400명 또는 평방마일당 1000명이었다.
이코노미
| 산토 토마스의 빈곤층 발생현황 | |
| 출처: 필리핀 통계청[14][15][16][17][18][19][20] | |
농업이 그 주된 수입원이다.가장 널리 퍼진 농장은 쌀, 옥수수, 담배 농장이었다.지역 주민들도 추가 수입을 위해 가축을 기른다.
참조
- ^ 산토 토마스 (DILG)
- ^ "2015 Census of Population, Report No. 3 – Population, Land Area, and Population Density" (PDF). Philippine Statistics Authority. Quezon City, Philippines. August 2016. ISSN 0117-1453. Archived (PDF) from the original on May 25, 2021. Retrieved July 16, 2021.
- ^ https://www.philatlas.com/luzon/r02/isabela/santo-tomas.html.
- ^ a b c Census of Population (2020). "Region II (Cagayan Valley)". Total Population by Province, City, Municipality and Barangay. PSA. Retrieved 8 July 2021.
- ^ https://psa.gov.ph/sites/default/files/City%20and%20Municipal-level%20Small%20Area%20Poverty%20Estimates_%202009%2C%202012%20and%202015_0.xlsx; 발행일: 2019년 7월 10일; 출판사: 필리핀 통계청.
- ^ "An Act Creating the Municipality of Mallig in the Province of Isabela". LawPH.com. Retrieved 2011-04-09.
- ^ "An Act Creating the Municipality of Quezon in the Province of Isabela". LawPH.com. Retrieved 2014-12-06.
- ^ "Province: Isabela". PSGC Interactive. Quezon City, Philippines: Philippine Statistics Authority. Retrieved 12 November 2016.
- ^ "Santo Tomas, Isabela: Average Temperatures and Rainfall". World Weather Online. Retrieved 31 October 2015.
- ^ Census of Population (2015). "Region II (Cagayan Valley)". Total Population by Province, City, Municipality and Barangay. PSA. Retrieved 20 June 2016.
- ^ Census of Population and Housing (2010). "Region II (Cagayan Valley)". Total Population by Province, City, Municipality and Barangay. NSO. Retrieved 29 June 2016.
- ^ Censuses of Population (1903–2007). "Region II (Cagayan Valley)". Table 1. Population Enumerated in Various Censuses by Province/Highly Urbanized City: 1903 to 2007. NSO.
{{cite encyclopedia}}: CS1 maint : url-status (링크) - ^ "Province of Isabela". Municipality Population Data. Local Water Utilities Administration Research Division. Retrieved 17 December 2016.
- ^ "Poverty incidence (PI):". Philippine Statistics Authority. Retrieved 28 December 2020.
- ^ https://psa.gov.ph/sites/default/files/NSCB_LocalPovertyPhilippines_0.pdf; 발행일: 2005년 11월 29일; 출판사: 필리핀 통계청.
- ^ https://psa.gov.ph/sites/default/files/2003%20SAE%20of%20poverty%20%28Full%20Report%29_1.pdf; 발행일: 2009년 3월 23일; 출판사: 필리핀 통계청.
- ^ https://psa.gov.ph/sites/default/files/2006%20and%202009%20City%20and%20Municipal%20Level%20Poverty%20Estimates_0_1.pdf; 발행일: 2012년 8월 3일; 출판사: 필리핀 통계청.
- ^ https://psa.gov.ph/sites/default/files/2012%20Municipal%20and%20City%20Level%20Poverty%20Estima7tes%20Publication%20%281%29.pdf; 발행일: 2016년 5월 31일; 출판사: 필리핀 통계청.
- ^ https://psa.gov.ph/sites/default/files/City%20and%20Municipal-level%20Small%20Area%20Poverty%20Estimates_%202009%2C%202012%20and%202015_0.xlsx; 발행일: 2019년 7월 10일; 출판사: 필리핀 통계청.
- ^ "PSA Releases the 2018 Municipal and City Level Poverty Estimates". Philippine Statistics Authority. 15 December 2021. Retrieved 22 January 2022.
외부 링크
| 위키미디어 커먼즈에는 산토 토마스, 이사벨라와 관련된 미디어가 있다. |
일라간(수도) | |
| 자치구 | |
| 컴포넌트 시티 | |
| 독립 컴포넌트 시티 | |
| 바랑게이 | 참고 항목: 이사벨라의 바랑게이 목록 |