마스로그
Maslog마스로그 | |
|---|---|
| 마스로그 시 | |
 마스로그가 강조 표시된 동사마르 지도 | |
오픈스트리트맵  | |
.svg) 마스로그 필리핀 내 소재지 | |
| 좌표:12°06ºN 125°10°E/12.1°N 125.17°E좌표: 12°06ºN 125°10ºE / 12.1°N 125.17°E / , | |
| 나라 | 필리핀 |
| 지역 | 동부비사야 주 |
| 지방 | 동사마르 주 |
| 구 | 론 구 |
| 바랑게이 | 12(Barangays 참조) |
| 정부 | |
| • 종류 | 상구니앙바얀 |
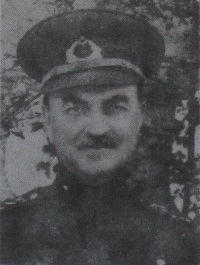
| • 시장 | 헤라클리오 C산티아고 |
| • 부시장 | 셉테미오 복 C. 산티아고 |
| • 담당자 | 마리아 페 R. 아우비아 |
| • 평의원 | 목록. |
| • 유권자 | 3,663명(2019년) |
| 지역 | |
| • 합계 | 249.8 km2 (96.4 평방 mi) |
| 승진 | 73 m (240 피트) |
| 최고 고도 | 329 m (1,079 피트) |
| 최저 고도 | 7 m (23 피트) |
| 인구. (인센서스) | |
| • 합계 | 5,463 |
| • 밀도 | 22/km2(57/157mi) |
| • 가구 | 1,062 |
| 경제. | |
| • 소득 계층 | 제5시 소득계급 |
| • 빈곤 발생률 | 73.43%(2018년)[4] |
| • 수익 | ₱106,779,835.23 (2020) |
| • 자산 | ₱188,333,220.49 (2020) |
| • 지출 | ₱84,681,276.16 (2020) |
| • 부채 | ₱29,755,998.87 (2020) |
| 서비스 프로바이더 | |
| • 전기 | 동사마 전기 협동조합(ESAMELCO) |
| 시간대 | UTC+8 (PST) |
| 우편번호 | 6820 |
| PSGC | |
| IDD : 지역번호 | +63 (0)55 |
| 원어민 | 와레이 타갈로그어 |
| 웹 사이트 | www |
Maslog, 공식 Maslog 시(Waray: Bungto han Maslog; 타갈로그:Bayan ng Maslog)는 필리핀 동사마르 주의 5급 지방 자치체이다.2020년 인구 조사에 따르면, 인구는 5,463명이다.[3]
지리
바랑게이
마스로그는 정치적으로 12개의 바랑게이로 나뉜다. [5]
기후.
| 동사마르의 마스로그 기후 데이터 | |||||||||||||
|---|---|---|---|---|---|---|---|---|---|---|---|---|---|
| 달 | 1월 | 2월 | 마루 | 에이프릴 | 그럴지도 모른다 | 준 | 줄 | 8월 | 9월 | 10월 | 11월 | 12월 | 연도 |
| 평균 최고 °C(°F) | 27 (81) | 27 (81) | 28 (82) | 29 (84) | 30 (86) | 30 (86) | 29 (84) | 29 (84) | 29 (84) | 29 (84) | 28 (82) | 28 (82) | 29 (83) |
| 평균 최저 °C(°F) | 22 (72) | 22 (72) | 22 (72) | 23 (73) | 24 (75) | 24 (75) | 24 (75) | 24 (75) | 24 (75) | 24 (75) | 23 (73) | 23 (73) | 23 (74) |
| 평균 강수량 mm(인치) | 97 (3.8) | 64 (2.5) | 69 (2.7) | 58 (2.3) | 98 (3.9) | 161 (6.3) | 167 (6.6) | 140 (5.5) | 158 (6.2) | 171 (6.7) | 169 (6.7) | 154 (6.1) | 1,506 (59.3) |
| 평균 비오는 날 | 17.1 | 13.4 | 14.8 | 15.2 | 21.1 | 25.2 | 26.8 | 25.4 | 25.5 | 26.5 | 23.0 | 20.3 | 254.3 |
| 출처 : Meteoblue. | |||||||||||||
인구 통계
| 연도 | Pop. | ±% p.a. |
|---|---|---|
| 1918 | 408 | — |
| 1939 | 769 | +3.06% |
| 1948 | 1,131 | +4.38% |
| 1960 | 1,593 | +2.89% |
| 1970 | 1,988 | +2.24% |
| 1975 | 1,886 | −1.05% |
| 1980 | 1,956 | +0.73% |
| 1990 | 3,089 | +4.68% |
| 1995 | 3,634 | +3.09% |
| 2000 | 4,009 | +2.13% |
| 2007 | 4,788 | +2.48% |
| 2010 | 4,781 | −0.05% |
| 2015 | 5,407 | +2.37% |
| 2020 | 5,463 | +0.20% |
| 출처 : 필리핀 통계청 | ||
2020년 인구조사에서 마스로그의 인구는 5,463명으로 평방 킬로미터 당 22명 또는 평방 마일 당 57명의 밀도를 보였다.
경제.
레퍼런스
- ^ 마스로그 시 (DILG)
- ^ "2015 Census of Population, Report No. 3 – Population, Land Area, and Population Density" (PDF). Philippine Statistics Authority. Quezon City, Philippines. August 2016. ISSN 0117-1453. Archived (PDF) from the original on May 25, 2021. Retrieved July 16, 2021.
- ^ a b c Census of Population (2020). "Region VIII (Eastern Visayas)". Total Population by Province, City, Municipality and Barangay. PSA. Retrieved 8 July 2021.
- ^ "PSA Releases the 2018 Municipal and City Level Poverty Estimates". Philippine Statistics Authority. 15 December 2021. Retrieved 22 January 2022.
- ^ "Province: Eastern Samar". PSGC Interactive. Quezon City, Philippines: Philippine Statistics Authority. Retrieved 12 November 2016.
- ^ "Maslog, Eastern Samar : Average Temperatures and Rainfall". Meteoblue. Retrieved 31 December 2018.
- ^ Census of Population (2015). "Region VIII (Eastern Visayas)". Total Population by Province, City, Municipality and Barangay. PSA. Retrieved 20 June 2016.
- ^ Census of Population and Housing (2010). "Region VIII (Eastern Visayas)". Total Population by Province, City, Municipality and Barangay. NSO. Retrieved 29 June 2016.
- ^ Censuses of Population (1903–2007). "Region VIII (Eastern Visayas)". Table 1. Population Enumerated in Various Censuses by Province/Highly Urbanized City: 1903 to 2007. NSO.
- ^ "Province of Eastern Samar". Municipality Population Data. Local Water Utilities Administration Research Division. Retrieved 17 December 2016.
- ^ "Poverty incidence (PI):". Philippine Statistics Authority. Retrieved 28 December 2020.
- ^ https://psa.gov.ph/sites/default/files/NSCB_LocalPovertyPhilippines_0.pdf;의 발행일: 2005년 11월 29일, 발행인: 필리핀 통계청.
- ^ https://psa.gov.ph/sites/default/files/2003%20SAE%20of%20poverty%20%28Full%20Report%29_1.pdf;의 발행일: 2009년 3월 23일, 발행인: 필리핀 통계청.
- ^ https://psa.gov.ph/sites/default/files/2006%20and%202009%20City%20and%20Municipal%20Level%20Poverty%20Estimates_0_1.pdf;의 발행일: 2012년 8월 3일, 발행인: 필리핀 통계청.
- ^ https://psa.gov.ph/sites/default/files/2012%20Municipal%20and%20City%20Level%20Poverty%20Estima7tes%20Publication%20%281%29.pdf;의 발행일: 2016년 5월 31일, 발행인: 필리핀 통계청.
- ^ https://psa.gov.ph/sites/default/files/City%20and%20Municipal-level%20Small%20Area%20Poverty%20Estimates_%202009%2C%202012%20and%202015_0.xlsx;의 발행일: 2019년 7월 10일, 발행인: 필리핀 통계청.
- ^ "PSA Releases the 2018 Municipal and City Level Poverty Estimates". Philippine Statistics Authority. 15 December 2021. Retrieved 22 January 2022.
외부 링크
Maslog에 인접한 장소 | |
|---|---|